Difference between revisions of "Asset management"
Jump to navigation
Jump to search

Jenny Hill (talk | contribs) m |
Jenny Hill (talk | contribs) m |
||
| Line 1: | Line 1: | ||
==Maintenance planning== | ==Maintenance planning== | ||
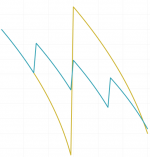
[[File:Asset sawtooth.png|thumb|150 px|link=https://public.tableau.com/views/AssetMaintenance/Dashboard2?:embed=y&:display_count=yes&publish=yes&:showVizHome=no|This image links to a Tableau dashboard, where the | [[File:Asset sawtooth.png|thumb|150 px|link=https://public.tableau.com/views/AssetMaintenance/Dashboard2?:embed=y&:display_count=yes&publish=yes&:showVizHome=no|In a sixty year period, three investments of $10 m (total investment $30 m) result in a similar asset value to a single complete replacement /rennovation of failed asset (investment of $50 m) afer thirty years. | ||
(Both scenarios depreciate at 1% anually.) This image links to a Tableau dashboard, where the data may be viewed in more detail.]] | |||
*http://docs.assets.eco.on.ca/reports/energy/2016-2017/Every-Drop-Counts-04.pdf | *http://docs.assets.eco.on.ca/reports/energy/2016-2017/Every-Drop-Counts-04.pdf | ||
Revision as of 18:29, 5 March 2018
Maintenance planning

In a sixty year period, three investments of $10 m (total investment $30 m) result in a similar asset value to a single complete replacement /rennovation of failed asset (investment of $50 m) afer thirty years. (Both scenarios depreciate at 1% anually.) This image links to a Tableau dashboard, where the data may be viewed in more detail.
- http://docs.assets.eco.on.ca/reports/energy/2016-2017/Every-Drop-Counts-04.pdf
- https://www.ontario.ca/page/building-together-guide-municipal-asset-management-plans