Difference between revisions of "Bioretention media storage"
Jump to navigation
Jump to search
Jenny Hill (talk | contribs) m |
Jenny Hill (talk | contribs) m |
||
| (29 intermediate revisions by the same user not shown) | |||
| Line 3: | Line 3: | ||
This has been calculated as the difference between the media porosity and field capacity from a number of studies. | This has been calculated as the difference between the media porosity and field capacity from a number of studies. | ||
# Marine sand: 0.51 - 0.06 = 0.45 <ref name=Liu>Liu, Ruifen, and Elizabeth Fassman-Beck. “Pore Structure and Unsaturated Hydraulic Conductivity of Engineered Media for Living Roofs and Bioretention Based on Water Retention Data.” Journal of Hydrologic Engineering 23, no. 3 (March 2018): 04017065. doi:10.1061/(ASCE)HE.1943-5584.0001621</ref> | |||
# Marine sand with 10 % compost: 0.51 - 0.11 = 0.40 <ref name=Liu/> | # Marine sand: 0.51 - 0.06 = 0.45 <ref name= Liu> Liu, Ruifen, and Elizabeth Fassman-Beck. “Pore Structure and Unsaturated Hydraulic Conductivity of Engineered Media for Living Roofs and Bioretention Based on Water Retention Data.” Journal of Hydrologic Engineering 23, no. 3 (March 2018): 04017065. doi:10.1061/(ASCE)HE.1943-5584.0001621</ref> | ||
# Marine sand with 20 % compost: 0.53 - 0.12 = 0.41 <ref name=Liu/> | # Marine sand with 10 % compost: 0.51 - 0.11 = 0.40 <ref name= Liu/> | ||
# Marine sand with 20 % compost & 20 % topsoil: 0.52 - 0.16 = 0.36 <ref name=Liu/> | # Marine sand with 20 % compost: 0.53 - 0.12 = 0.41 <ref name= Liu/> | ||
# Sand: 0.46 - 0.1 = 0.36 <ref>Saxton, K E, and W J Rawls. “Soil Water Characteristic Estimates by Texture and Organic Matter for Hydrologic Solutions.” Soil Science Society of America Journal, 2006. doi:10.2136/sssaj2005.0117. </ref> | # Marine sand with 20 % compost & 20 % topsoil: 0.52 - 0.16 = 0.36 <ref name= Liu/> | ||
# NC sandy bioretention mix: 0.47 - 0.07 = 0.40 <ref>Davis, Allen P., Robert G. Traver, William F. Hunt, Ryan Lee, Robert A. Brown, and Jennifer M. Olszewski. “Hydrologic Performance of Bioretention Storm-Water Control Measures.” Journal of Hydrologic Engineering 17, no. 5 (May 2012): 604–14. doi:10.1061/(ASCE)HE.1943-5584.0000467.</ref> | # Sand: 0.46 - 0.1 = 0.36 <ref> Saxton, K E, and W J Rawls. “Soil Water Characteristic Estimates by Texture and Organic Matter for Hydrologic Solutions.” Soil Science Society of America Journal, 2006. doi:10.2136/sssaj2005.0117. </ref> | ||
# Bioretention soil I: 0.71 - 0.1 = 0.61 <ref name=Li>Li, Houng, and Allen P. Davis. “Urban Particle Capture in Bioretention Media. I: Laboratory and Field Studies.” Journal of Environmental Engineering 134, no. 6 (June 2008): 409–18. doi:10.1061/(ASCE)0733-9372(2008)134:6(409).</ref> | # NC sandy bioretention mix: 0.47 - 0.07 = 0.40 <ref> Davis, Allen P., Robert G. Traver, William F. Hunt, Ryan Lee, Robert A. Brown, and Jennifer M. Olszewski. “Hydrologic Performance of Bioretention Storm-Water Control Measures.” Journal of Hydrologic Engineering 17, no. 5 (May 2012): 604–14. doi:10.1061/(ASCE)HE.1943-5584.0000467.</ref> | ||
# Bioretention soil I: 0.71 - 0.1 = 0.61 <ref name= Li> Li, Houng, and Allen P. Davis. “Urban Particle Capture in Bioretention Media. I: Laboratory and Field Studies.” Journal of Environmental Engineering 134, no. 6 (June 2008): 409–18. doi:10.1061/(ASCE)0733-9372(2008)134:6(409).</ref> | |||
# Bioretention soil II: 0.52 - 0.1 = 0.42 <ref name= Li/> | # Bioretention soil II: 0.52 - 0.1 = 0.42 <ref name= Li/> | ||
# M minus mean θ<sub>ini</sub>: 0.76 - 0.32 = 0.44 <ref>Roy-Poirier, A., Y. Filion, and P. Champagne. “An Event-Based Hydrologic Simulation Model for Bioretention Systems.” Water Science and Technology 72, no. 9 (November 11, 2015): 1524–33. doi:10.2166/wst.2015.368.</ref> | # M minus mean θ<sub>ini</sub>: 0.76 - 0.32 = 0.44 <ref> Roy-Poirier, A., Y. Filion, and P. Champagne. “An Event-Based Hydrologic Simulation Model for Bioretention Systems.” Water Science and Technology 72, no. 9 (November 11, 2015): 1524–33. doi:10.2166/wst.2015.368.</ref>: | ||
---- | ---- | ||
: | |||
Latest revision as of 00:45, 12 November 2018
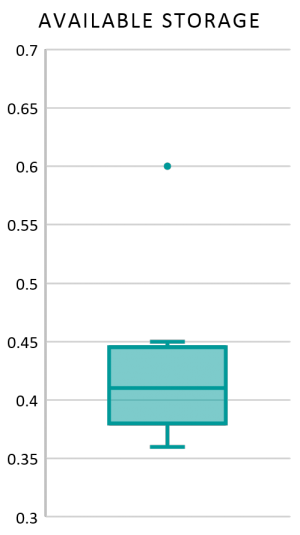
Bioretention filter media may be assumed to have a storage capacity of 0.4.
This has been calculated as the difference between the media porosity and field capacity from a number of studies.
- Marine sand: 0.51 - 0.06 = 0.45 [1]
- Marine sand with 10 % compost: 0.51 - 0.11 = 0.40 [1]
- Marine sand with 20 % compost: 0.53 - 0.12 = 0.41 [1]
- Marine sand with 20 % compost & 20 % topsoil: 0.52 - 0.16 = 0.36 [1]
- Sand: 0.46 - 0.1 = 0.36 [2]
- NC sandy bioretention mix: 0.47 - 0.07 = 0.40 [3]
- Bioretention soil I: 0.71 - 0.1 = 0.61 [4]
- Bioretention soil II: 0.52 - 0.1 = 0.42 [4]
- M minus mean θini: 0.76 - 0.32 = 0.44 [5]:
- ↑ 1.0 1.1 1.2 1.3 Liu, Ruifen, and Elizabeth Fassman-Beck. “Pore Structure and Unsaturated Hydraulic Conductivity of Engineered Media for Living Roofs and Bioretention Based on Water Retention Data.” Journal of Hydrologic Engineering 23, no. 3 (March 2018): 04017065. doi:10.1061/(ASCE)HE.1943-5584.0001621
- ↑ Saxton, K E, and W J Rawls. “Soil Water Characteristic Estimates by Texture and Organic Matter for Hydrologic Solutions.” Soil Science Society of America Journal, 2006. doi:10.2136/sssaj2005.0117.
- ↑ Davis, Allen P., Robert G. Traver, William F. Hunt, Ryan Lee, Robert A. Brown, and Jennifer M. Olszewski. “Hydrologic Performance of Bioretention Storm-Water Control Measures.” Journal of Hydrologic Engineering 17, no. 5 (May 2012): 604–14. doi:10.1061/(ASCE)HE.1943-5584.0000467.
- ↑ 4.0 4.1 Li, Houng, and Allen P. Davis. “Urban Particle Capture in Bioretention Media. I: Laboratory and Field Studies.” Journal of Environmental Engineering 134, no. 6 (June 2008): 409–18. doi:10.1061/(ASCE)0733-9372(2008)134:6(409).
- ↑ Roy-Poirier, A., Y. Filion, and P. Champagne. “An Event-Based Hydrologic Simulation Model for Bioretention Systems.” Water Science and Technology 72, no. 9 (November 11, 2015): 1524–33. doi:10.2166/wst.2015.368.
