Difference between revisions of "OGS: Performance"
(Created page with "{{TOClimit|2}} ==TSS Reduction== 200px|thumb ===Inlet=== The performance results for OGS practices, located within TRCA's watershed originate from three primary sites: *Woodside SmartCentre (Markham) *North Queen Street & The Queensway (Etobicoke) The mean performance value recorded at the inlet for OGS practices' ability to remove Total Suspended Sediments (TSS) was was calculated based on 46 separate recordings between 1997 - 1998 amongs...") |
|||
| Line 29: | Line 29: | ||
As can be seen in the corresponding boxplot the mean performance removal efficiency of the OGS practices monitored are well below the suggested guideline of 30 mg/L (Canadian Water Quality Guideline (CWQG), or (background (assumed at <5 mg/L)+ 25 mg/L for short term (<24 hour) exposure) (CCME, 2002<ref>Canadian Council of Ministers of the Environment (CCME). 2002. Canadian water quality guidelines for the protection of aquatic life: Total particulate matter. In: Canadian Environmental Quality Guidelines, Canadian Council of Ministers of the Environment, Winnipeg</ref>; (TRCA, 2021<ref>TRCA. 2021. Spatial Patterns (2016-2020) and Temporal Trends (1966-2020) in Stream Water Quality across TRCA’s Jurisdiction Prepared by Watershed Planning and Ecosystem Science. https://trcaca.s3.ca-central-1.amazonaws.com/app/uploads/2021/10/29113334/2016-2020-SWQ-Report-v11_FINAL_AODA-FA.pdf</ref>). | As can be seen in the corresponding boxplot the mean performance removal efficiency of the OGS practices monitored are well below the suggested guideline of 30 mg/L (Canadian Water Quality Guideline (CWQG), or (background (assumed at <5 mg/L)+ 25 mg/L for short term (<24 hour) exposure) (CCME, 2002<ref>Canadian Council of Ministers of the Environment (CCME). 2002. Canadian water quality guidelines for the protection of aquatic life: Total particulate matter. In: Canadian Environmental Quality Guidelines, Canadian Council of Ministers of the Environment, Winnipeg</ref>; (TRCA, 2021<ref>TRCA. 2021. Spatial Patterns (2016-2020) and Temporal Trends (1966-2020) in Stream Water Quality across TRCA’s Jurisdiction Prepared by Watershed Planning and Ecosystem Science. https://trcaca.s3.ca-central-1.amazonaws.com/app/uploads/2021/10/29113334/2016-2020-SWQ-Report-v11_FINAL_AODA-FA.pdf</ref>). | ||
The median value of the 91 samples taken was '''44.50 mg/L''' whereas the mean was '''64.60 mg/L''', with a '''61%''' guideline exceedance. Given the age of of these practices and the dates monitoring took place, these systems will likely need major maintenance and/or rehabilitation if not full replacement, as they near the end of their working lifecycle, especially given forthcoming Ontario guidelines on removal efficiencies, set to release later in 2023 ([https://ero.ontario.ca/notice/019-4971#supporting-materials Low Impact Development Stormwater Management Guidance Manual] | The median value of the 91 samples taken was '''44.50 mg/L''' whereas the mean was '''64.60 mg/L''', with a '''61%''' guideline exceedance. Given the age of of these practices and the dates monitoring took place, these systems will likely need major maintenance and/or rehabilitation if not full replacement, as they near the end of their working lifecycle, especially given forthcoming Ontario guidelines on removal efficiencies, set to release later in 2023 ([https://ero.ontario.ca/notice/019-4971#supporting-materials Low Impact Development Stormwater Management Guidance Manual]). Read more about the performance efficiency of these specific OGS installations located within TRCA's watershed here, in the following document - [https://sustainabletechnologies.ca/app/uploads/2013/03/OGS-ES.pdf Performance Assessment of Two Types of Oil & Grit Separator for SWM in Parking Lots] (SWAMP, 2004<ref>Stormwater Assessment Monitoring and Performance (SWAMP) Program. 2004. Performance Assessment of Two Types of Oil and Grit Separator for Stormwater Management in Parking Lot Applications – Markham & Toronto, Ontario. Report prepared for - Ontario Ministry of Environment, Toronto and Region Conservation Authority, Municipal Engineers Association of Ontario, and The City of Toronto. Published: July, 2004. Retrieved from: https://sustainabletechnologies.ca/app/uploads/2013/03/OGS_entire-report.pdf</ref>). | ||
<br> | <br> | ||
Revision as of 19:48, 16 February 2023
TSS Reduction[edit]
Inlet[edit]
The performance results for OGS practices, located within TRCA's watershed originate from three primary sites:
- Woodside SmartCentre (Markham)
- North Queen Street & The Queensway (Etobicoke)
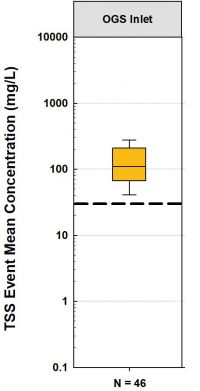
The mean performance value recorded at the inlet for OGS practices' ability to remove Total Suspended Sediments (TSS) was was calculated based on 46 separate recordings between 1997 - 1998 amongst the two sites previously mentioned.
As can be seen in the corresponding boxplot the mean performance removal efficiency of the OGS practices monitored are well below the suggested guideline of 30 mg/L (Canadian Water Quality Guideline (CWQG), or (background (assumed at <5 mg/L)+ 25 mg/L for short term (<24 hour) exposure) (CCME, 2002[1]; (TRCA, 2021[2]).
The median value of the 46 samples taken was 109.50 mg/L whereas the mean was 145.07 mg/L, with a 96% guideline exceedance.
Outlet[edit]
The performance results for OGS practices, located within TRCA's watershed originate from three primary sites:
- Woodside SmartCentre (Markham)
- North Queen Street & The Queensway (Etobicoke)
The mean performance value recorded at the inlet for OGS practices' ability to remove Total Suspended Sediments (TSS) was was calculated based on 46 separate recordings between 1997 - 1998 amongst the two sites previously mentioned.
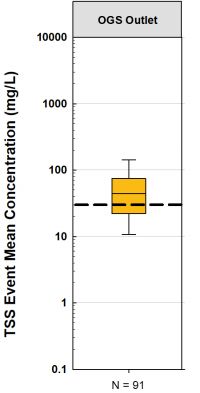
As can be seen in the corresponding boxplot the mean performance removal efficiency of the OGS practices monitored are well below the suggested guideline of 30 mg/L (Canadian Water Quality Guideline (CWQG), or (background (assumed at <5 mg/L)+ 25 mg/L for short term (<24 hour) exposure) (CCME, 2002[3]; (TRCA, 2021[4]).
The median value of the 91 samples taken was 44.50 mg/L whereas the mean was 64.60 mg/L, with a 61% guideline exceedance. Given the age of of these practices and the dates monitoring took place, these systems will likely need major maintenance and/or rehabilitation if not full replacement, as they near the end of their working lifecycle, especially given forthcoming Ontario guidelines on removal efficiencies, set to release later in 2023 (Low Impact Development Stormwater Management Guidance Manual). Read more about the performance efficiency of these specific OGS installations located within TRCA's watershed here, in the following document - Performance Assessment of Two Types of Oil & Grit Separator for SWM in Parking Lots (SWAMP, 2004[5]).
Refer to the Oil and Grit Separator page for more information related to updated requirements through laboratory testing in accordance with the Procedure for Laboratory Testing of Oil-Grit Separators PDF (TRCA/CETV Program) testing protocol and will have current and valid ISO14034: Environmental Technology Verification (ETV) program.
Recent Performance Research[edit]
| Location | Filter media composition | Media depth (cm) | Internal water storage depth (cm) | I/P ratio | Runoff volume reduction (%) | TSS reduction (%) | TN reduction (%) | TP reduction (%) |
|---|---|---|---|---|---|---|---|---|
| Montréal[7] | 88% sand, 8% fines, 4% OM | 180 | 150 | 47 | 97 | 99 | 99 | 99 |
| Virginia[8] | 88% sand, 8% fines, 4% OM | 180 | 150 | 47 | 97 | 99 | 99 | 99 |
| North Carolina[9] | 96% sand, 4% fines | 110 | 88 | 12 | 89 | 58 | 58 | -10 |
| 58 | 93 | |||||||
| 96 | 72 | 13 | 98 | |||||
| 42 | 100 | |||||||
| North Carolina[10] | loamy sand, 3% OM | 120 | 60 | 20 | 99 | - | - | - |
| North Carolina[11] | 98% sand, 2% fines | 90 | 30 | 12 | 90 | - | - | - |
| 90 | 60 | 12 | 98 | - | - | - | ||
| North Carolina[12] | 15% sand, 80% fines, 5% OM | 60 | 45 | 68 | - | - | 54 | 63 |
| 90 | 75 | 68 | - | - | 54 | 58 |
- (USEPA, 2013) - Evaluation and Optimization of Bioretention Design for Nitrogen and Phosphorus Removal
- USEPA conducted both field and laboratory testing on the performance of bioretention with augmented designs and filter media composition with aluminum hydroxide/oxide content, found normally within water treatment residuals. These additives added at 10-15% of the total filter media mix ad median removal efficiencies of 90-99% of orthophosphate and a second study found a bioretention design with WTR mixture in the filter media and a IWSZ optimized to remove phosphorus and nitrogen had a removal efficiency of 20% and effluent concentrations below 20µg/L (well below the MECP/CCME guideline in Ontario).

- (Ho and Lin, 2022) - Pollutant Removal Efficiency of a Bioretention Cell with Enhanced Dephosphorization
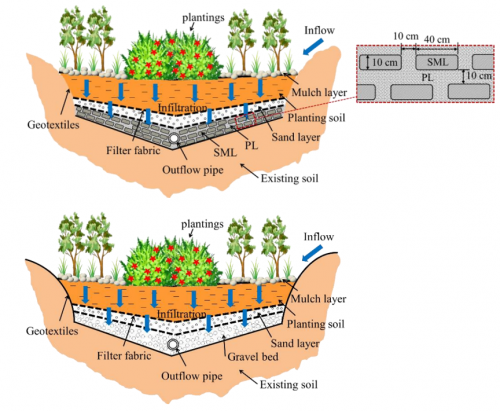
- Authors Ho and Lin, 2022 note that bioretention practices perform poorly in reducing phosphorus from influent stormwater when compared to their ability to remove ammonia and COD pollutants. The authors tested a new type of enhanced dephosphorization bioretention cell (EBC) which improves phosphorus removal performance. The difference between EBC and a traditional bioretention cell is that the lowest level of an EBC feature is comprised of a mixed fill material layer (permeable layers - PLs and soil mixed layers - SMLs) instead of a traditional gravel bed layer. The SMLs include active charcoal powder, organic matter and iron, evenly spaced apart, while the PLs include aggregates of gravel, pumice and zeolite. Over the two years that the same sized EBC feature was monitored in comparison to a standard bioretention cell they found that the EBC outperformed the traditional bioretention cell by removing 92% of total phosphorus to 52%. The average inflow concentration for both features from May 2019 - April 2021 was 0.76 mg/L, whereas the outflow concentration averages were 0.36 mg/L for the traditional bioretention cell and 0.06 mg/L for the EBC, respectively (Ho and Lin, 2022)[14].
- (STEP, 2019) - Improving nutrient retention in bioretention - Technical Brief
- STEP researchers developed a study to examine the effectiveness of reactive media amendments as a means of enhancing phosphorus retention in a bioretention cell draining a 1150 m2 parking lot in the City of Vaughan. For testing purposes, the bioretention was divided into three hydrologically distinct cells: (1) with a high sand, low phosphorus media mix (control); (2) with a proprietary reactive media (Sorbitve™) mixed into the sandy filter media, and (3) with a 170 cm layer of iron rich sand (aka red sand) below the sandy filter media. Outflow quantity and quality from each cell was measured directly, while inflows and runoff quality were estimated based on monitoring of an adjacent asphalt reference site over the same time period. The results found that the Sorbitve™ and the Iron rich (red) sand cells had lower concentrations of Total Phosphorus (among other contaminants) in its effluent outflow, and the TP measured was below the CCDME guideline of 0.03mg/L in both years monitored for Sorbitve™ (2016 & 2017) and 2017 for the cell with Iron rich (red) sand. Both cells had median concentrations lower than the control media cell used in the study by at least 68% for TP (STEP, 2019[15].
- (Ament, et al. 2022) - Phosphorus removal, metals dynamics, and hydraulics in stormwater bioretention systems amended with drinking water treatment residuals
- Researchers from the University of Minnesota, the University of Vermont and the USEPA, conducted field experiment to test the effectiveness of Drinking water treatment residuals (DWTRs) as a filter media amendment additive for improve Total Phosphorus (TP) removal in roadside bioretention features. Influent phosphorus levels was relatively low when compared to normal influent stormwater P levels (dissolved = 0.002 mg/L, soluble reactive = 0.022, particulate = 0.036 mg/L) but the difference between the bioretention cell in the study with DWTR additives and the control bioretention cells were 95% (Large D.A) - 97% (small D.A) TP removal and 79 (large D.A)and 91% (small D.A) respectively. The outflows were well below the CCME guidelines of 0.3 mg/L coming in at 0.010 mg/L (large D.A) and 0.011mg/L (small D.A) (Ament, et al. 2022)[16].)
- (Qiu, et al. 2019) - Enhanced Nutrients Removal in Bioretention Systems Modified with Water Treatment Residual and Internal Water Storage Zone
- Researchers from Beijing University and Auburn University, conducted lab experiments with two bioretention columns (1) with Water treatment residuals (WTRs - i.e. polyaluminium chloride & dewatered sludge from a surface water treatment plant) (15% dried weight, the remaining 85% sandy loam) and the second (2) filled with traditional sandy loam for its filter bed material. Their pollutant rmeova lefficiency for TSS was virtually the same, treating between 100 - 400 mg/L over 10 separate test cycles in a 50-day period. The effluent TSS levels were bot hless than 20 mg/L (10 mg/L less than the CCME requirement in Ontario) with removal percentages above 90% on average to a maximum of 97%. Meanwhile, for Total Phosphorus removal (TP) the column with 15% WTRs added boated a mean TP removal of 99.6% with a maximum effluent of 0.08 mg/L after remoting an average influent concentration load of 4.0 – 7.0 mg/L) (Qiu, et al. 2019)[17].
References[edit]
- ↑ Canadian Council of Ministers of the Environment (CCME). 2002. Canadian water quality guidelines for the protection of aquatic life: Total particulate matter. In: Canadian Environmental Quality Guidelines, Canadian Council of Ministers of the Environment, Winnipeg
- ↑ TRCA. 2021. Spatial Patterns (2016-2020) and Temporal Trends (1966-2020) in Stream Water Quality across TRCA’s Jurisdiction Prepared by Watershed Planning and Ecosystem Science. https://trcaca.s3.ca-central-1.amazonaws.com/app/uploads/2021/10/29113334/2016-2020-SWQ-Report-v11_FINAL_AODA-FA.pdf
- ↑ Stormwater Assessment Monitoring and Performance (SWAMP) Program. 2004. Performance Assessment of Two Types of Oil and Grit Separator for Stormwater Management in Parking Lot Applications – Markham & Toronto, Ontario. Report prepared for - Ontario Ministry of Environment, Toronto and Region Conservation Authority, Municipal Engineers Association of Ontario, and The City of Toronto. Published: July, 2004. Retrieved from: https://sustainabletechnologies.ca/app/uploads/2013/03/OGS_entire-report.pdf
- ↑ Liu J, Sample D, Bell C, Guan Y. Review and Research Needs of Bioretention Used for the Treatment of Urban Stormwater. Water. 2014;6(4):1069-1099. doi:10.3390/w6041069.
- ↑ Géhéniau N, Fuamba M, Mahaut V, Gendron MR, Dugué M. Monitoring of a Rain Garden in Cold Climate: Case Study of a Parking Lot near Montréal. J Irrig Drain Eng. 2015;141(6):4014073. doi:10.1061/(ASCE)IR.1943-4774.0000836.
- ↑ DeBusk KM, Wynn TM. Storm-Water Bioretention for Runoff Quality and Quantity Mitigation. J Environ Eng. 2011;137(9):800-808. doi:10.1061/(ASCE)EE.1943-7870.0000388.
- ↑ Brown RA, Asce AM, Hunt WF, Asce M. Underdrain Configuration to Enhance Bioretention Exfiltration to Reduce Pollutant Loads. J Environ Eng. 2011;137(11):1082-1091. doi:10.1061/(ASCE)EE.1943-7870.0000437.
- ↑ Li H, Sharkey LJ, Hunt WF, Davis AP. Mitigation of Impervious Surface Hydrology Using Bioretention in North Carolina and Maryland. J Hydrol Eng. 2009;14(4):407-415. doi:10.1061/(ASCE)1084-0699(2009)14:4(407).
- ↑ Brown RA, Hunt WF. Bioretention Performance in the Upper Coastal Plain of North Carolina. In: Low Impact Development for Urban Ecosystem and Habitat Protection. Reston, VA: American Society of Civil Engineers; 2008:1-10. doi:10.1061/41009(333)95.
- ↑ Passeport E, Hunt WF, Line DE, Smith RA, Brown RA. Field Study of the Ability of Two Grassed Bioretention Cells to Reduce Storm-Water Runoff Pollution. J Irrig Drain Eng. 2009;135(4):505-510. doi:10.1061/(ASCE)IR.1943-4774.0000006.
- ↑ Ho, C.C. and Lin, Y.X., 2022. Pollutant Removal Efficiency of a Bioretention Cell with Enhanced Dephosphorization. Water, 14(3), p.396. https://mdpi-res.com/books/book/5900/Urban_Runoff_Control_and_Sponge_City_Construction.pdf?filename=Urban_Runoff_Control_and_Sponge_City_Construction.pdf#page=168
- ↑ Ho, C.C. and Lin, Y.X., 2022. Pollutant Removal Efficiency of a Bioretention Cell with Enhanced Dephosphorization. Water, 14(3), p.396. https://mdpi-res.com/books/book/5900/Urban_Runoff_Control_and_Sponge_City_Construction.pdf?filename=Urban_Runoff_Control_and_Sponge_City_Construction.pdf#page=168
- ↑ STEP. 2019. Improving nutrient retention in bioretention - Technical Brief. Prepared by Toronto and Region Conservation Authority. Published in 2018. https://sustainabletechnologies.ca/app/uploads/2019/06/improving-nutrient-retention-in-bioretention-tech-brief.pdf
- ↑ Ament, M.R., Roy, E.D., Yuan, Y. and Hurley, S.E., 2022. Phosphorus removal, metals dynamics, and hydraulics in stormwater bioretention systems amended with drinking water treatment residuals. Journal of Sustainable Water in the Built Environment, 8(3), p.04022003.
- ↑ Qiu, F., Zhao, S., Zhao, D., Wang, J. and Fu, K., 2019. Enhanced nutrient removal in bioretention systems modified with water treatment residuals and internal water storage zone. Environmental Science: Water Research & Technology, 5(5), pp.993-1003.

