Double ring infiltrometers
Packing list[edit]
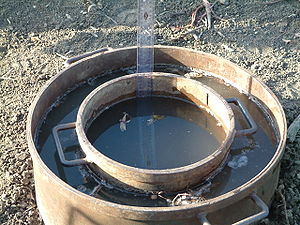
• Small ring (28 – 32 cm) • Large ring (53 – 57 cm) • Sledge hammer for driving rings into ground • Wooden block to distribute force when driving rings into ground • Level • Two metal rulers with clips to secure • Container for water • Screwdriver or similar implement to dislodge rocks
Installation[edit]
- Choose or create clear, level ground at the desired test location.
- Work with minimal disturbance to the soil within the test area.
- Place the wooden block across the ring and use the sledge hammer to drive the ring into the ground by ≥ 5 cm.
- Check that the ring is level in all directions and correct as necessary.
- Repeat with the second ring (note that the order may vary if the rings are of differing heights.
- Both rings should be firm into the ground.
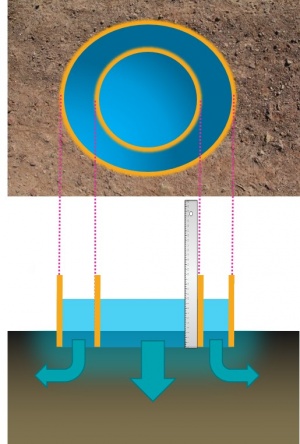
- Secure the metal rulers to the inside of the rings.
Measurements[edit]
- To begin measurements gently pour 5 – 10 cm of water into both the inner and outer rings.
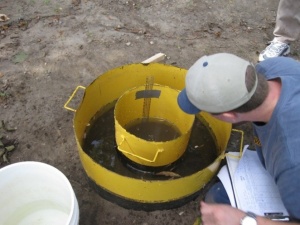
- Measurement of the water depth should be made every 15 minutes for the first hour, 30 minutes in the second hour and then hourly up to 6 hours.
- The rings should be covered to reduce evaporation, particularly in hot weather and when the soil is clayey and infiltration is slow.
Calculations[edit]
Using the DRI (double ring infiltrometer) spreadsheet
The Solver add-in[edit]
To use the calculation spreadsheet, an additional add-in must be enabled in your Excel program.
- Go to ‘File’ in your menu toolbar and select ‘Options’ from the menu,
- Choose ‘Add-ins’ and then at the bottom of the window, for ‘Manage Add-ins’, select ‘Go’.
- Check the box for the ‘Solver’ add-in and then ‘OK’.
- Your new Solver add-in appears on the right end of the ‘Data’ toolbar in the main Excel window. It is useful for solving all kinds of iterative equations.
Performing calculations[edit]
- Save a new copy of your spreadsheet.
- Enter time and water level data into the clear spaces of the sheet.
- Rows may be added or removed as required,
- Check that the data is 'complete' i.e. that unused rows have been deleted,
- Check that the no errors have appeared in the calculation columns.
- The orange box shows the sum of squares (i.e. the error between the current model and the measured data). The objective of our calculation is to minimize this number by finding the best S (Soil sorptivity) and A (parameter) for our soil.
- Open the Solver,
- Set objective: (select orange cell),
- To: (choose ‘Min’),
- By changing variable cells: (select the pink cells, for the S and A numbers),
- Leave the constraints box empty,
- Ensure that the ‘GRG nonlinear’ Solving method is selected,
- ‘Solve’!
- The solver produces the optimized S and A values to match the model to the field data.
- The saturated hydraulic conductivity (K) is approximated by dividing A by 2/3, where A is the slope of the linear part of the graph. i.e when infiltration rate has stabilized.


