Difference between revisions of "Vegetated Filter Strip: Life Cycle Costs"
| Line 29: | Line 29: | ||
==Construction Costs== | ==Construction Costs== | ||
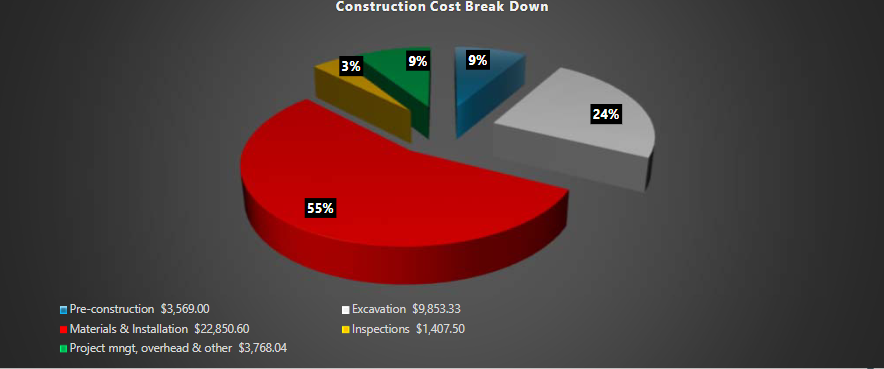
[[File:Construction Breakdown | [[File:Construction Breakdown VegStrip Full Infil.PNG|thumb|center|950px|'''Construction Costs Per Unit Drainage Area (CAD$/m<sup>2</sup>) - Full Infiltration Design, 25 mm Treatment''']] | ||
| Line 35: | Line 35: | ||
Above you can find a cost breakdown of | Above you can find a cost breakdown of vegetated filter strips in the following configuration type:<br> | ||
#[[ | #[[Vegetated filter strips|Vegetated Filter Strips: Full Infiltration]] | ||
The Material & Installation expenses represent the largest portion of total construction costs ( | The Material & Installation expenses represent the largest portion of total construction costs (55%). | ||
==Life Cycle Costs== | ==Life Cycle Costs== | ||
Revision as of 20:46, 20 December 2022

Overview[edit]
Vegetated filter strips (A.K.A: buffer strips and grassed filter strips) are gently sloping, densely vegetated areas that treat runoff as sheet flow from adjacent impervious areas. They slow runoff velocity and filter out suspended sediment and associated pollutants, and provide some infiltration into underlying soils. Vegetated filter strips are generally used as pretreatment to other LID practices. Finally, filter strips also provide a convenient location for snow storage and treatment during the winter months. STEP has prepared life cycle costs estimates for each design configuration, based on a 2,000 m2 roof drainage area, runoff control target of 25 mm depth and 72 hour drainage period, for comparison which can be viewed below. To generate your own life cycle cost estimates customized to the development context, design criteria, and constraints applicable to your site, access the updated LID Life Cycle Costing Tool (LCCT) here.
Design Assumptions[edit]
Vegetated filter strips are gently sloping, densely vegetated areas designed to treat runoff as sheet flow from adjacent impervious areas. Filter strips function by slowing runoff velocities and filtering out sediment and other pollutants. Filter strips may be comprised of a variety of trees, shrubs, and vegetation to add aesthetic value as well as water quality benefits.
Design and operation and maintenance program assumptions used to generate cost estimates are based on tool default values and the following STEP recommendations:
- Native soil infiltration rates for Full, Partial and No Infiltration Design scenarios were assumed to be 20 mm/h, 10 mm/h and 2 mm/h, respectively, and a safety factor of 2.5 was applied to calculate the design infiltration rate.
- Operation and maintenance (O&M) cost estimates assume annual inspections, removal of trash and debris twice a year, removal of sediment from pretreatment structures annually, and removal of weeds twice a year (where applicable). Verification inspections are included every 5 years to confirm adequate maintenance, and every 15 years to confirm adequate drainage performance through in-situ surface infiltration rate testing (where applicable)
- Maximum contributing flow path length across adjacent impervious surfaces should not exceed 25 metres.
- Impervious surfaces draining to a filter strip should not have slopes greater than 3%.
- The flow path length across the vegetated filter strip should exceed the maximum flow path length across the impervious surface draining to it.
- Have a flow path length of at least 5 metres.
Notes[edit]
- The tool calculates costs for new (greenfield) development contexts and includes costs for contractor overhead and profit, material, delivery, labour, equipment (rental, operating and operator costs), hauling and disposal.
- Land value and equipment mobilization and demobilization costs are not included, assuming BMP construction is part of overall development site construction.
- Design and Engineering cost estimates are not calculated by the tool and must be supplied by the user.
- The tool adds 10% contingency and additional overhead as default.
- All cost estimates are in Canadian dollars and represent the net present value (NPV) as the tool takes into account average annual interest and discount rates over the 25 and 50 year operating life cycle periods.
- Unit costs are based on 2018 RSMeans standard union pricing.
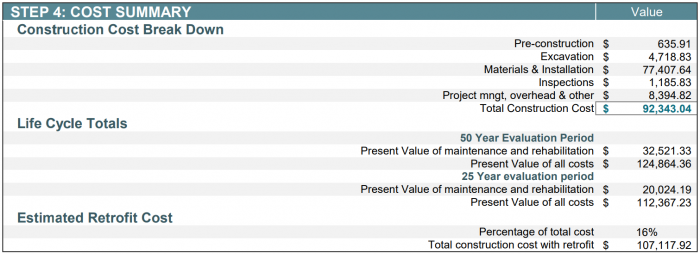
- Additional costs associated with retrofit or redevelopment contexts is assumed to be 16% of the cost estimate for new (greenfield) construction contexts.
- Retrofit construction cost estimates are included in the 'Costs Summary' section for comparison.
- Retrofit construction cost estimates are included in the 'Costs Summary' section for comparison.
Construction Costs[edit]
Note: Please click on each image to enlarge to view associated construction cost estimates.
Above you can find a cost breakdown of vegetated filter strips in the following configuration type:
The Material & Installation expenses represent the largest portion of total construction costs (55%).
Life Cycle Costs[edit]
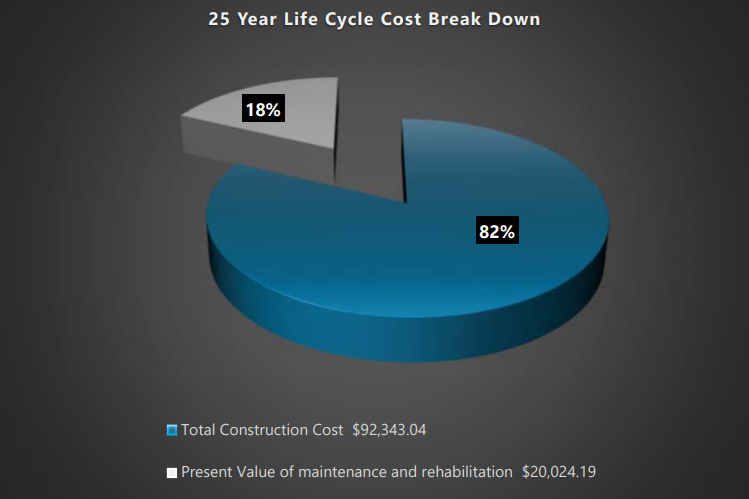
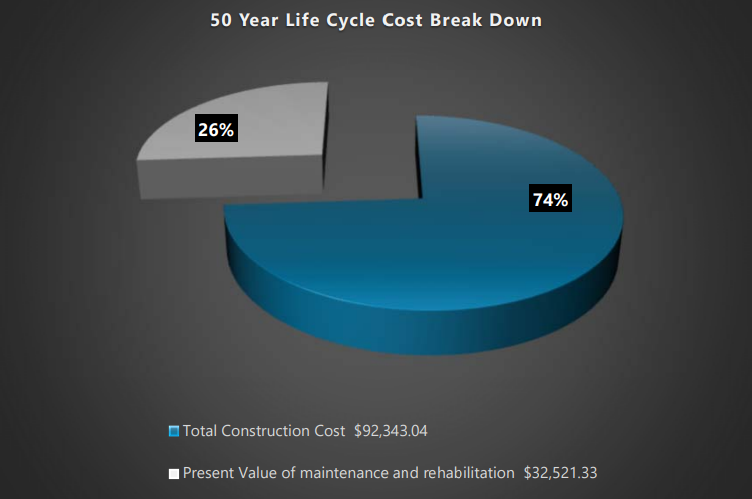
Below are capital and life cycle cost estimates for an Underground Rainwater Cistern, Non-Infiltrating configuration over 25- and 50-year time periods. The estimates of maintenance and rehabilitation (life cycle) costs represent net present values. Operation and maintenance costs are predicted to represent 18% of total life cycle costs over the 25-year evaluation period, and increase to 26% of total life cycle costs over the 50-year period, due to increased levels of litter removal, cleaning out of tank, cleaning the in-line filter, replacing components (pump and pressure tank), cistern pump performance testing.
25-Year life cycle cost break down[edit]
Note: Click on each image to enlarge to view associated life cycle cost estimate.
50-Year life cycle cost break down[edit]
Note: Click on each image to enlarge to view associated life cycle cost estimate.
Cost Summary Tables[edit]
Total life cycle cost estimates for an Underground Rainwater Cistern, Non-Infiltrating configuration is ($92,343.04), making it one of the cheapest LID BMP options.
It is notable that a sensitivity analysis was conducted in 2019 to compare construction cost estimates generated by the tool to actual costs of implemented projects. The analysis found that tool estimates were typically within ±14% of actual construction costs[1]
Full Infiltration[edit]
References[edit]
- ↑ Credit Vally Conservation (CVC). 2019. Life-cycle costing tool 2019 update: sensitivity analysis. Credit Valley Conservation, Mississauga, Ontario. https://sustainabletechnologies.ca/app/uploads/2020/04/LCCT-Sensitivity-Analysis_March2020.pdf
