Bioretention
This article is about planted installations designed to capture and infiltrate some or all of the stormwater received.
For simple systems, without underdrains or storage reservoirs (typically found in residential settings), see Rain gardens.
For linear systems that have a gradually sloping filter media bed and convey flow, but are otherwise similar to bioretention, see Bioswales.
For planted systems that do not infiltrate water, see Stormwater planters.
Overview[edit]
Bioretention systems may be the most well recognized form of low impact development (LID). They can fit into any style of landscape and utilize all of the stormwater treatment mechanisms: sedimentation, infiltration, filtration, attenuation and evapotranspiration.
Bioretention is an ideal technology for:
- Fitting multi-functional vegetation into urban landscapes
- Treating runoff collected from nearby impervious surfaces
Take a look at the downloadable Bioretention Factsheet below for a .pdf overview of this LID Best Management Practice:

The fundamental components of a bioretention cell are:
- Inlets which may be curb openings (e.g. modified curbs, spillways), pipes, road or side inlet catchbasins, trench drains or other pre-fabricated inlet structures;
- A surface ponding area defined by landscaped side slopes or hardscape structures and the invert elevation of the overflow outlet structure;
- A filter bed containing filter media;
- A filter bed surface cover layer (e.g. mulch and stone);
- Plants, and;
- An overflow outlet to limit surface ponding and safely convey excess flow to a downstream storm sewer or the next BMP in the treatment train.
Additional components may include:
- An underdrain to redistribute or remove excess water and access structures or standpipes for periodic inspection and flushing;
- An internal water storage reservoir composed of a reservoir aggregate layer, and may include embedded void-forming structures to minimize depth and conserve aggregate, and organic material derived from untreated wood (aids in dissolved nitrogen removal);
- Monitoring wells installed to the base and screened in the underdrain aggregate to verify and track drainage time; and
- Filter media additives intended to enhance retention of nutrients, metals, petroleum hydrocarbons and/or bacteria.
Planning considerations[edit]
Note Site Considerations from the Bioretention Fact Sheet [1] in the 2010 CVC/TRCA LID Stormwater Management Planning Design are detailed below and within links included
Infiltration[edit]
Some form of stormwater landscaping (bioretention) can be integrated into most spaces. Although there are some constraints to infiltrating water, it is preferable to do so where possible. Designing bioretention without an underdrain is highly desirable wherever the soils permit infiltration at a rate which is great enough to empty the facility between storm events. Volume reduction is achieved primarily through infiltration to the underlying soils, with some evapotranspiration. As there is no outflow from this BMP under normal operating conditions, it is particularly useful in areas where nutrient management is a concern to the watershed.
Bioretention with an underdrain is a popular choice in areas with 'tighter' soils where infiltration rates are < 15 mm/hr. Including a perforated pipe in the reservoir aggregate layer helps to empty the facility between storm events, which is particularly useful in areas with low permeability soils. The drain discharges to a downstream point, which could be an underground infiltration trench or chamber facility. Volume reduction is gained through infiltration and evapotranspiration. By raising the outlet of the discharge pipe the bottom portion of the BMP can only drain through infiltration, creating an internal water storage reservoir. This creates a fluctuating anaerobic/aerobic environment which promotes denitrification. Increasing the period of storage has benefits for promoting infiltration, but also improves water quality for catchments impacted with nitrates. A complimentary technique is to include fresh wood mulch in the storage reservoir aggregate, which fosters denitrifying biological processes.
Where infiltration is entirely impossible, but the design calls for planted landscaping, try a stormwater planter instead.
Space[edit]
- For optimal performance bioretention facilities should receive runoff from impervious drainage areas between 5 to 20 times their own permeable footprint surface area.
- In the conceptual design stage it is recommended to set aside approximately 10 - 20 % of the contributing drainage area for bioretention facility placement.
- Bioretention cells work best when distributed, so that no one facility receives runoff from more than 0.8 Ha, although there is a trade off to be considered regarding distributed collection and treatment versus ease of maintenance.
- Bioretention can be almost any shape, from having very curvilinear, soft edges with variable depth, to angular, hard-sided and uniform depth.
- For ease of construction and to ensure that the vegetation has adequate space, cells should be no narrower than 0.6 m at any point.
- The maximum width of a facility is determined by the reach of the construction machinery, which must not be tracked into the cell.
- Setback from buildings: A typical four (4) metre setback is recommended from building foundations. If an impermeable liner is used, no setback is needed.
- Proximity to underground utilities and overhead wires: Consult with local utility companies regarding horizontal and vertical clearance required between storm drains, ditches, and surface water bodies. Further, check whether the future tree canopy height in the bioretention area will not interfere with existing overhead wires.
The principles of bioretention can be applied in any scenario where planting or vegetation would normally be found.
Private sites[edit]
In single family residential sites rain gardens most often take the form of a soft edged, traditional perennial planting bed. As many private industrial, commercial and institutional sites have landscaping around their parking lots, bioretention is an increasingly popular choice to manage stormwater in these contexts.
Streetscape[edit]
Bioretention is a popular choice for making urban green space work harder. Design configurations include extending the cells to accommodate shade trees, and using retrofit opportunities to create complete streets with traffic calming and curb extensions or 'bump outs'. See Bioretention: Streetscapes
Parkland and natural areas[edit]
Naturalized landscaping and soft edges can make a bioretention facility 'disappear' into green space surroundings. In some scenarios, a larger bioretention (50 - 800 m2) cell may be used as an end-of-pipe facility treating both sheet flow and concentrated flow before it enters an adjacent water course. In these larger installations care must be made in the design to distribute the inflow, preventing erosion and maximizing infiltration.
Design[edit]
| Poor design choice: Limits outflow water quality |
Better design choice: Improves outflow water quality |
|---|---|
| Single large cell design | Several smaller distributed or connected cells |
| Single concentrated inflow | Forebays or distributed flow |
| No pretreatment | Pretreatment provided as part of inlet design |
| Over-sized underdrain | Moderately sized underdrain (or no underdrain) |
| Filter bed < 0.5 m | Filter bed > 0.75 m |
| Filter media Plant-Available Phosphorus > 40 ppm | Filter media Plant-Available Phosphorus < 40 ppm |
| Filter media is predominantly sand | Filter media is a mixture of sand, topsoil and organic material |
| Surface covered with turf grass and stone | Surface covered with mulch and dense, deeply rooting vegetation |
Sizing and Modelling[edit]
Bioretention facilities should be sized to accommodate runoff from approximately 5 to 20 times the footprint area of the facility. i.e. they should have an I/P ratio of 5 to 20. When the drainage area is too large, silt can accumulate very rapidly, overwhelm the pretreatment devices, and lead to clogging of the facility. When the drainage area is relatively small compared to the bioretention facility, it can make the facility unreasonably costly.
Inlets and pretreatment options[edit]
Options for pretreatment include:
- A level spreader, gravel diaphragm or Vegetated filter strip for sheet flow
- A forebay for concentrated surface flow
- An oil and grit separator for concentrated underground flow
Simple (non-treating) inlets include:
- Sheet flow from a pavement edge or flush curb
- One of more curb cuts
- Covered drains
Overflow routing[edit]

Routing[edit]
- Infiltration facilities can be designed to be inline or offline from the drainage system. See Inlets
- Inline facilities accept all of the flow from a drainage area and convey larger event flows through an overflow outlet. The overflow must be sized to safely convey larger storm events out of the facility.
- The overflow must be situated at the maximum surface ponding elevation or furthest downgradient end of the facility to limit surface ponding during periods of flow in excess of the facility storage capacity.
- Offline facilities use flow splitters or bypass channels that only allow the design storm runoff storage volume to enter the facility. Higher flows are conveyed to a downstream storm sewer or other BMP by a flow splitting manhole weir or pipe, or when the maximum surface ponding depth has been reached, by by-passing the curb opening and flowing into a downstream catchbasin connected to a storm sewer.
Overflow elevation[edit]
The invert of the overflow should be placed at the maximum water surface elevation of the practice (i.e. the maximum surface ponding level). A good starting point is 150 to 350 mm above the surface of the mulch cover. However, consideration should be given to public safety, whether or not an underdrain is included, the time required for ponded water to drain through the filter bed surface, and if no underdrain is present, into the underlying native soil (must drain within 48 hours). See Bioretention: Sizing and Stormwater planters for more details.
Freeboard[edit]
- In swales conveying flowing water a freeboard of 300 mm is generally accepted as a good starting point.
- In bioretention the freeboard is the difference between the invert elevation of the overflow structure and the inlet. 150 mm will suffice, so long as the inlet will not become inundated during design storm conditions.
- In above grade stormwater planters, the equivalent dimension would be the difference between the invert elevation of the overflow structure and the lip of the planter (150 mm minimum)
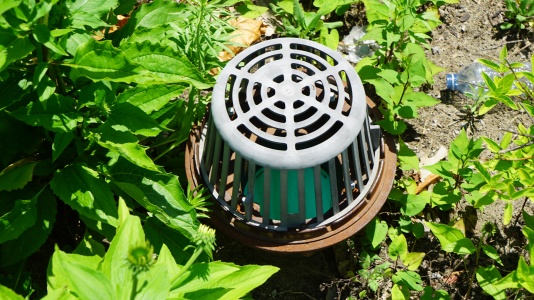
Overflow outlet options[edit]
Metal grates are recommended (over plastic) in all situations.
| Feature | Anti Vandalism/Robust | Lower Cost Option | Self cleaning |
|---|---|---|---|
| Dome grate | x | ||
| Flat grate | x | ||
| Catch basin | x | ||
| Ditch inlet catch basin | x | x | |
| Curb cut | x | x | x |
Gallery[edit]
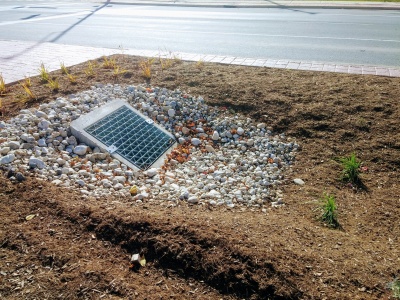
Flat metal overflow with stone surround to reduce erosion around the cast concrete structure. Mississauga Road, ON
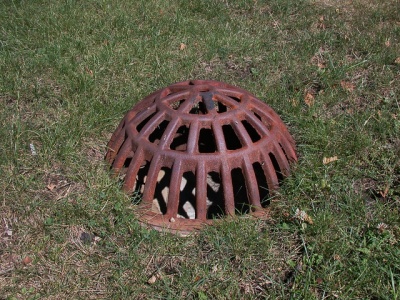
Domed, metal overflow grate
Photo credit: Aaron Volkening Being flush with the surface reduces potential infiltration of ponded water.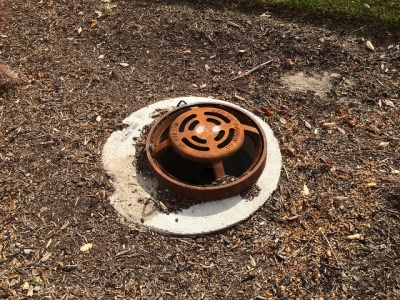
Overflow inlet for newly constructed stormwater bioretention areas in median of Bradley Road. Village of Brown Deer, Wisconsin. Bradley Road, east of 51st Street. Photo from October 2015. Constructed summer 2015.
Photo credit: Aaron Volkening
Flat, metal overflow grate in Emeryville California Stormwater Curb Extension
Note the greyish colour change indicating UV degradation of this plastic overflow inlet in a bioretention cell; metal is recommended instead. Mississauga ON.


Plant Selection[edit]
The nature of bioretention cells is to attenuate stormwater from rainfall events of varying intensities. For this reason, the vegetation used must be suitable for the varying moisture conditions and is often categorized into three zones related to the grading of the feature.
- Low Zone -- This area is frequently inundated during storm events, and is well-drained between rainfall events.
- Mineral Meadow Marsh plant community.
- Grasses, sedges, rushes, wildflowers, ferns and shrubs that have an ‘obligate’ to ‘facultative’ designation.
- Wetland 'obligate' species that are flood tolerant as they will persist in average years and flourish in wetter years.
- Plants that are likely to occur in wetlands or adjacent to wetlands.
- Plants with dense root structure and /or vegetative cover are favoured for their ability to act as pollution filters and tendency to slow water velocity.
- Be advised these practices are not constructed wetlands and are designed to fully drain within 48 hours.
- Mid Zone -- This zone is inundated less frequently (2 – 100 year storm events) and has periodically high levels of moisture in the soil. The ecology of this zone is a transition from the Mineral Meadow Marsh/Beach-type community to an upland community.
- Plants able to survive in soils that are seasonally saturated, yet can also tolerate periodic drought.
- Species include grasses and groundcovers, as well as low shrub species.
- High Zone -- The ecology of this zone is terrestrial due to its elevation in relation to the filter bed. The zone most closely resembles a Cultural Meadow or a Cultural Thicket community, depending on the mix of grasses, herbaceous material, shrubs and trees utilized.
- Plants should have deep roots for structure, be drought-tolerant and capable of withstanding occasional soil saturation.
- Trees and large shrubs planted in this zone will aid in the infiltration and absorption of stormwater.
- This area can be considered a transition area into other landscape or site areas.
- A variety (min. five) species should be used to avoid monocultures.
Exposure to roadway or parking lot runoff must be considered.
- Exposure to roadway or parking lot runoff
- Select salt tolerant grasses, other herbaceous material and shrubs.
- These can take on several forms, including parking lot islands, traffic islands, roundabouts, or cul-de-sacs and are often used as snow storage locations.
- No exposure to roadway or parking lot runoff
- Practices allow for a greater range of species selection.
- These receive runoff from rooftops or areas that use no deicing salt and have low pollutant exposure, such as courtyard bioretention.
Other selection factors:
- Most bioretention cells will be situated to receive full sun exposure. The ‘Exposure’ column in the plant lists identifies the sun exposure condition for each species.
- Facilities with a deeper filter media bed (e.g., 1 m) provide the opportunity for a wider range of plant species (including trees).
- The inclusion of vegetation with a variety of moisture tolerances ensures that the bioretention cell will adapt to a variety of weather conditions.
- Proper spacing must be provided for above-ground and below-ground utilities, and adjacent infrastructure.
- Where possible, a combination of native trees, shrubs, and perennial herbaceous materials should be used.
- A planting mix with evergreen and woody plants will provide appealing textures and colors year round, but are not appropriate for areas where snow will be stored/piled during winter.
- In areas where less maintenance will be provided and where trash accumulation in shrubbery or herbaceous plants is a concern, consider a “turf and trees” landscaping model.
- If trees are to be used, or the bioretention is located in a shaded location, then ensure that the chosen herbaceous plants are shade tolerant.
- Spaces for herbaceous flowering plants can be included. This may be attractive at a community entrance location or in a residential rain garden.
Tables for identifying ideal species for bioretention are found in the Plant lists. See plant selection and planting design for supporting advice.
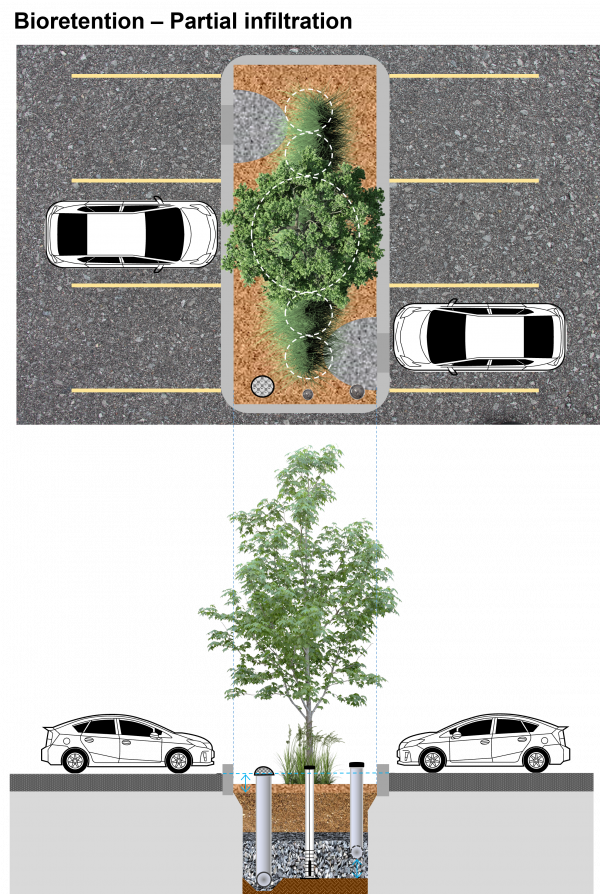
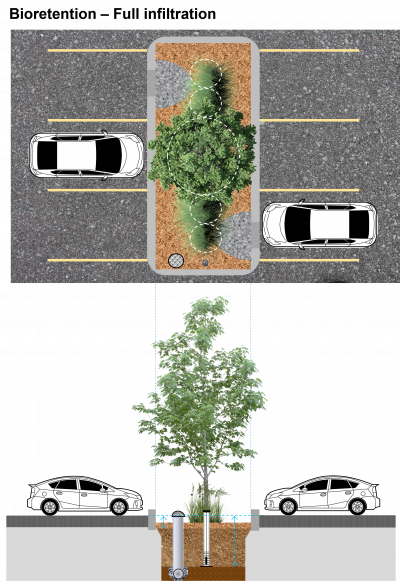
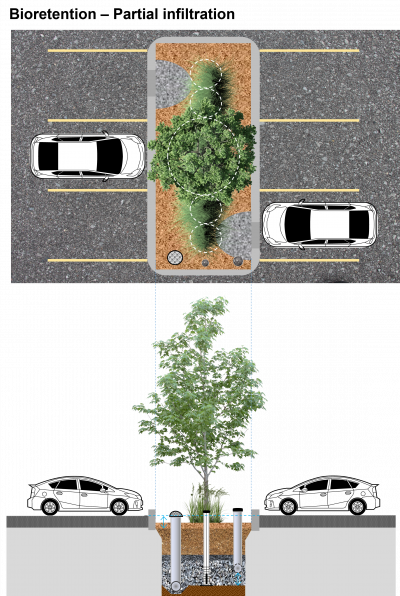
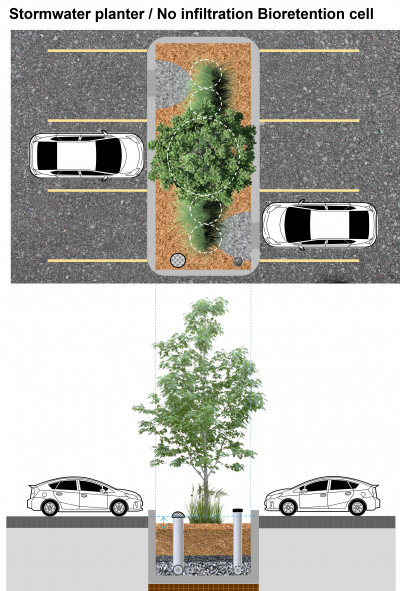
Variations of Bioretention Cells[edit]
Below, find three alternate Bioretention cell configurations, that differ based off whether developers want the system to infiltrate incoming water fully, partially, or not at all due to sites which possess contaminated soils or shallow bedrock, and/or zero-lot-line developments (i.e. condo developments and dense urban infill).
All the images below are image map drawings from the following pages to compare side-by-side the differences between varying configurations.
Performance[edit]
| BMP | Water Balance | Water Quality | Erosion Control |
|---|---|---|---|
| Bioretention with no underdrain | Yes | Yes-size for water quality storage requirement | Partial-based on available storage volume and native soil infiltration rate |
| Bioretention with underdrain | Partial-based on available storage, native soil infiltration rate and if a flow restrictor is used | Yes-size for water quality storage requirement | Partial-based on available storage, native soil infiltration rate and if a flow restrictor is used |
| Bioretention with underdrain and liner | No-some volume reduction occurs through evapotranspiration | Yes-size for water quality storage requirement | Partial-some volume reduction occurs through evapotranspiration |
Water Balance[edit]
Bioretention practices have been shown to reduce runoff volume through both means of evapotranspiration and infiltration. The primary body of research is separated into bioretention practices either with underdrains and those without (therefore, relying solely on full infiltration into underlying soils). Volumetric performance improves when:
- Native soils have high infiltration capacity and facility is designed for full infiltration, without an underdrain;
- Size of the impervious drainage area relative to the facility permeable footprint area (i.e., I:P area ratio) is kept within recommended range of 5:1 (HSG C and D soils) to 20:1 (HSG A and B soils).
- Perforated pipe or outlet connection is elevated above the bottom of the practice in the underdrain cross-section;
- A flow restrictor (e.g., orifice, valve) is installed on the underdrain or storm sewer outlet pipe.
| LID Practice | Location | Runoff Reduction* | Reference |
|---|---|---|---|
| Bioretention without underdrain | China | 85 to 100%* | Gao, et al. (2018)[1] |
| Connecticut | 99% | Dietz and Clausen (2005) [2] | |
| Pennsylvania | 80% | Ermilio (2005)[3] | |
| Pennsylvania | 70% | Emerson and Traver (2004)[4] | |
| Bioretention with underdrain | |||
| Ontario | 64% | CVC (2020)[5] | |
| Ontario | 66% | STEP (2019)[6] | |
| Texas | 82%* | Mahmoud, et al. (2019)[7] | |
| China | 35 to 75%* | Gao, et al. (2018)[8] | |
| Ohio | 36 to 59% | Winston et al. (2016)[9] | |
| Ontario | 90% | STEP (2015)[10] | |
| Ontario | 91 to 96% | TRCA (2014)[11] | |
| Virginia | 97 to 99% | DeBusk and Wynn (2011)[12] | |
| Maryland and North Carolina | 20 to 50% | Li et al. (2009) [13] | |
| North Carolina | 40 to 60% | Smith and Hunt (2007)[14] | |
| North Carolina | 33 to 50% | Hunt and Lord (2006) [15] | |
| Bioretention with underdrain & liner | |||
| Ontario | 15 to 34% | STEP (2019) [16] | |
| Queensland, Australia | 33 to 84% | Lucke and Nichols (2015) [17] | |
| Victoria, Australia | 15 to 83% | Hatt et al. (2009)[18] | |
| Maryland | 49 to 58% | Davis (2008)[19] | |
| Runoff Reduction Estimate* | 85% without underdrain;
45% with underdrain | 30% with underdrain and liner | ||
Water Quality[edit]
Performance results from both laboratory and field studies indicate that bioretention systems have the potential to be one of the most effective BMPs for pollutant removal (TRCA, 2009). Bioretention provides effective removal for many pollutants as a result of sedimentation, filtering, soil adsorption, microbial processes and plant uptake. It is also important to note that there is a relationship between the water balance and water quality functions. If a bioretention cell infiltrates and evaporates 85 to 100% of the runoff from the drainage area during the design storm event, then there is little to no pollution leaving the site in surface runoff. Furthermore, treatment of infiltrated runoff continues to occur as it moves through the native soil.
A comparative performance assessment of bioretention in Ontario was conducted comparing 9 different bioretention facilities in the GTA. The results showed total suspended solids (TSS) load reductions between 88 to 99%, and total phosphorus load reductions between 68 and 92% for unlined facilities. Results for a lined bioretention swale for TSS and Total Phosphorus load reduction were 73 to 79% and -18 to -21% respectively.(STEP, 2019)[20]. Negative TP load reduction values were observed because effluent concentrations were higher than influent concentrations, and volume reduction through evapotranspiration was not sufficient to offset the increase in phosphorus concentration in biofilter effluent. (STEP, 2018)[21]. Other STEP studies in the Greater Toronto Area have displayed similar results, with 90% reduction in TSS load when compared to nearby asphalt runoff samples having median TSS concentrations near the provincial 30 mg/L standard (median = ~19 mg/L) STEP, 2014 [22].
Another group of studies of bioretention facilities examines nutrient removal of these LID installation, with mixed results. Some facilities have been observed to increase total phosphorus in infiltrated water (Dietz and Clausen, 2005[23]; Hunt and Lord, 2006[24] ; TRCA, 2008[25]). These findings have been attributed to leaching from filter media soil mixtures which contained high phosphorus content. To avoid phosphorus export, the plant-available (extractable) phosphorus content of the filter media soil mixture should be examined prior to installation and kept between 12 to 40 ppm (see Filter media; Hunt and Lord, 2006). A design option to increase phosphorus removal performance of bioretention is to incorporate additives into the filter media bed, either blended into the media or as a layer in the aerobic portion of the filter bed, such as iron filings (i.e., zero valent iron)[26], fly ash[27] [28], iron (ferric) or aluminum hydroxide-based water treatment residuals (by-product from drinking water treatment)[29] [30], biochar [31] [32], proprietary filter media additives or blends, or by using iron-rich sand in the filter media blend. Read about a field evaluation comparing the phosphorus retention performance of parking lot bioretention cells featuring iron-rich sand and proprietary reactive media additive (Sorptive PTM) in the STEP technical brief[33]. While moderate reductions in total nitrogen and ammonia nitrogen have been observed in laboratory studies (Davis et al., 2001[34]) and field studies (Dietz and Clausen, 2005[35]), nitrate nitrogen removal has consistently been observed to be low. Design innovations to enhance nitrate-nitrogen removal performance of bioretention is an area of active research. Promising results have been observed from laboratory column and field-scale evaluations of underdrained practices featuring internal water storage reservoirs containing mixtures of clear stone aggregate and shredded newspaper or wood chips, which creates low oxygen or anoxic conditions and promotes conversion of nitrate-nitrogen to nitrogen gas via denitrification [36] [37] [38].
Roseen et al. (2013) conducted both field and laboratory testing on the performance of bioretention cells featuring filter media amended with drinking water treatment residuals (WTR) with low solids content (5-10% solids) as an additive. Water treatment residuals were included at 10-15% of the total filter media mix by volume. Amended bioretention cells had median orthophosphate removal efficiencies of 90-99%. A second study found a bioretention design featuring WTR amended filter media and an internal water storage zone optimized to remove phosphorus and nitrogen had an orthophosphate removal efficiency of 20% and effluent concentrations below 0.02 mg/L.[39] More recently, LeFevre et al. (2015) present a state-of-the-art review of dissolved stormwater pollutant sources (focusing on nutrients, toxic metals and organic compounds), typical concentrations, and removal mechanisms and fate in bioretention, along with design options to enhance their retention [40].

The two box plot figures to the right show combined stormwater effluent quality results from STEP monitoring projects conducted over a 16-year time period (between 2005 and 2021) at sites within Greater Toronto Area (GTA) municipalities. Total Suspended Solid (TSS) effluent concentration results for bioretention practices represent the combined results from 9 sites in the GTA and a total of 301 monitored storm events. Median TSS concentration was found to be 9.5 mg/L and exceeded the Canadian Water Quality Guideline of 30 mg/L (CCME, 2002[41]) during only 15% of the 301 monitored storm events. Median TP concentration was found to be 0.09 mg/L and exceeded the Ontario Provincial Water Quality Objective (PWQO) of 0.03 mg/L (OMOEE, 1994[42]) during 86% of monitored storm events. In comparison, median TP effluent concentration for bioretention in the International Stormwater BMP Database was found to be 0.240 mg/L, based on 850 monitored storm events (Clary et al. 2020)[43], which is well above the Ontario PWQO of 0.03 mg/L. These results indicate that the design of bioretention draining to phosphorus-limited receiving waterbodies should include variations to improve Phosphorus retention. An example of such a design variation is including sorption additives in Bioretention: Filter media. Please refer to the Phosphorus and Additives pages for further guidance.

The mechanisms involved in, and ability of bioretention to reduce bacteria and other microbial pathogen concentrations is also an area of active research. Preliminary laboratory and field study results report good but variable removal rates for fecal coliform bacteria from biofilters and bioretention cells (Rusciano and Obropta, 2005[44]; Hunt et al., 2006[45]; TRCA, 2008[46]). In a recent review, Clary et al. (2020) report bioretention E.coli removal efficiency of 42.5% and fecal coliform removal efficiency of 99.4% based on median inlet and outlet concentrations from 12 and 8 studies, respectively [47]. In a recent article, Peng et al. (2016) review factors influencing microbial removal and effects of design choices on treatment performance. They found that approaches for improving the removal of microorganisms by biofilters could involve altering the grain size range and surface properties of the filter media. This could involve the use of filter media with smaller average grain sizes, the inclusion of additives (e.g., activated carbon, zeolite, or biochar) to improve filtration rates, or chemical modifications of filter media grain surfaces (e.g., with biocides) to promote microbial die-off. Including an internal water storage reservoir was also found to improve microbial removal rates [48].
Recent research into the role of plants in bioretention confirms they play an important roles in hydraulic and nitrogen removal performance. In a recent review of scientific literature, Dagenais et al. (2018) found that planted facilities are more effective than unplanted ones, as the presence of plants increases filter bed permeability and nitrogen removal. Plant species selection can considerably affect hydraulic and nitrogen removal performance, with root traits (e.g., thickness and depth) identified as playing important roles. They identified further research needed to test the hypothesis that native or diversely-planted facilities perform better than ones planted with exotic or fewer species.[49]
Stream Channel Erosion[edit]
The feasibility of storing the channel erosion control volume within bioretention areas will be dependent on the size of the drainage area and available space. Meeting the channel erosion control requirement through bioretention is most feasible in the regions of the Greater Toronto Area with Hydrologic Soil Group A and B soils. In these situations, the reduction in runoff volume through infiltration and evapotranspiration may be sufficient. For facilities with constrained footprints, include a flow restrictor on the underdrain perforated pipe or outlet storm sewer to control the release rate, and size the internal water storage reservoir to retain the necessary volume of water. Where acceptable, consider increasing the maximum ponding depth beyond the recommended 350 mm. It is important to note that the bioretention practice will infiltrate runoff into the filter media bed and underlying native soil over the duration of the design storm event, which can be factored into surface ponding and internal water storage reservoir sizing to optimize the design. See Sizing for further guidance.
Other Benefits[edit]
The benefits of bioretention reach beyond the specific stormwater management goals to other social and environmental benefits, including:
- Reduced thermal aquatic impacts: Bioretention and other filtration and infiltration practices benefit aquatic life by reducing thermal impacts on receiving waters from urban runoff (Jones and Hunt, 2009[50]). Unlike detention ponds, bioretention does not raise water temperature and can help maintain baseflows through infiltration.
- Snow Storage: Bioretention areas can be used for snow storage and snow melt treatment from the contributing drainage area during winter, especially those located adjacent to parking lots and roadways. To function as snow storage, bioretention must include an overflow for snow melt in excess of the designed ponding depth. Additionally, the plant material must be salt-tolerant, perennial and tolerant of periodic inundation.
- Reduced Urban Heat Island: Bioretention is able to reduce the local urban heat island by introducing soils and vegetation into urban areas, such as parking lots. Vegetation absorbs less solar radiation than hard urban surfaces. Also, the water vapor emitted by plant material also cools ambient temperatures.
See also[edit]
External links[edit]
- City of Toronto Green Streets Technical Guidelines - Version 1.0 (2017) Schollen & Company Inc., Urban Forest Innovators, TMIG, DMG
- CSA W200-18 Design of Bioretention Systems (2018) CSA Group
- CSA W201-18 Construction of Bioretention Systems (2018) CSA Group
- Bioretention Design Guidelines (2014) Healthy Waterways (Australia)
- ↑ Gao, J., Pan, J., Hu, N. and Xie, C., 2018. Hydrologic performance of bioretention in an expressway service area. Water Science and Technology, 77(7), pp.1829-1837.
- ↑ Dietz, M.E. and J.C. Clausen. 2005. A field evaluation of rain garden flow and pollutant treatment. Water Air and Soil Pollution. Vol. 167. No. 2. pp. 201-208. http://citeseerx.ist.psu.edu/viewdoc/download?doi=10.1.1.365.9417&rep=rep1&type=pdf
- ↑ Ermilio, J.F., 2005. Characterization study of a bio-infiltration stormwater BMP (Doctoral dissertation, Villanova University). https://www1.villanova.edu/content/dam/villanova/engineering/vcase/vusp/Ermilio-Thesis06.pdf
- ↑ Emerson, C., Traver, R. 2004. The Villanova Bio-infiltration Traffic Island: Project Overview. Proceedings of 2004 World Water and Environmental Resources Congress (EWRI/ASCE). Salt Lake City, Utah, June 22 – July 1, 2004. https://ascelibrary.org/doi/book/10.1061/9780784407370
- ↑ Credit Valley Conservation. 2020. IMAX Low Impact Development Feature Performance Assessment. https://sustainabletechnologies.ca/app/uploads/2022/03/rpt_IMAXreport_f_20220222.pdf
- ↑ Sustainable Technologies Evaluation Program. 2019. Improving nutrient retention in bioretention. https://sustainabletechnologies.ca/app/uploads/2019/06/improving-nutrient-retention-in-bioretention-tech-brief.pdf
- ↑ Mahmoud, A., Alam, T., Rahman, M.Y.A., Sanchez, A., Guerrero, J. and Jones, K.D. 2019. Evaluation of field-scale stormwater bioretention structure flow and pollutant load reductions in a semi-arid coastal climate. Ecological Engineering, 142, p.100007. https://www.sciencedirect.com/science/article/pii/S2590290319300070
- ↑ Gao, J., Pan, J., Hu, N. and Xie, C., 2018. Hydrologic performance of bioretention in an expressway service area. Water Science and Technology, 77(7), pp.1829-1837.
- ↑ Winston, R.J., Dorsey, J.D. and Hunt, W.F. 2016. Quantifying volume reduction and peak flow mitigation for three bioretention cells in clay soils in northeast Ohio. Science of the Total Environment, 553, pp.83-95.
- ↑ Sustainable Technologies Evaluation Program. 2015. Performance Comparison of Surface and Underground Stormwater Infiltration Practices. https://sustainabletechnologies.ca/app/uploads/2016/08/BioVSTrench_TechBrief__July2015.pdf
- ↑ Toronto and Region Conservation Authority. 2014. Performance Evaluation of a Bioretention System - Earth Rangers, Vaughan. Sustainable Technologies Evaluation Program. https://sustainabletechnologies.ca/app/uploads/2014/09/STEP-Bioretention-Report_2014.pdf
- ↑ DeBusk, K.M. and Wynn, T.M., 2011. Storm-water bioretention for runoff quality and quantity mitigation. Journal of Environmental Engineering, 137(9), pp.800-808. https://www.webpages.uidaho.edu/ce431/Articles/DeBusk-ASCE-2011.pdf
- ↑ Li, H., Sharkey, L.J., Hunt, W.F., and Davis, A.P. 2009. Mitigation of Impervious Surface Hydrology Using Bioretention in North Carolina and Maryland. Journal of Hydrologic Engineering. Vol. 14. No. 4. pp. 407-415.
- ↑ Smith, R and W. Hunt. 2007. Pollutant removals in bioretention cells with grass cover. Proceedings 2nd National Low Impact Development Conference. Wilmington, NC. March 13-15, 2007.
- ↑ Hunt, W.F. and Lord, W.G. 2006. Bioretention Performance, Design, Construction, and Maintenance. North Carolina Cooperative Extension Service Bulletin. Urban Waterways Series. AG-588-5. North Carolina State University. Raleigh, NC.
- ↑ STEP. 2019. Comparative Performance Assessment of Bioretention in Ontari0. Technical Brief. https://sustainabletechnologies.ca/app/uploads/2019/10/STEP_Bioretention-Synthesis_Tech-Brief-New-Template-2019-Oct-10.-2019.pdf.
- ↑ Lucke, T., & Nichols, P. W. B. 2015. The pollution removal and stormwater reduction performance of street-side bioretention basins after ten years in operation. Science of The Total Environment, 536, 784-792. doi:http://dx.doi.org/10.1016/j.scitotenv.2015.07.142
- ↑ Hatt, B. E., Fletcher, T. D., & Deletic, A. 2009. Hydrologic and pollutant removal performance of stormwater biofiltration systems at the field scale. Journal of Hydrology, 365(3), 310-321. doi:http://dx.doi.org/10.1016/j.jhydrol.2008.12.001
- ↑ Davis, A.P. 2008. Field performance of bioretention: Hydrology impacts. Journal of hydrologic engineering, 13(2), pp.90-95. https://ascelibrary.org/doi/abs/10.1061/(ASCE)1084-0699(2008)13:2(90)
- ↑ STEP. 2019. Comparative Performance Assessment of Bioretention in Ontario - Technical Brief.
- ↑ Sustainable Technologies Evaluation Program. 2018. Effectiveness of Retrofitted Roadside Biofilter Swales - County Court Boulevard, Brampton Technical Brief. https://sustainabletechnologies.ca/app/uploads/2020/11/CC-Bioswale-Tech-brief-2018-FINAL.pdf
- ↑ Sustainable Technologies Evaluation Program. 2014. Performance Evaluation of a Bioretention System - Earth Rangers. Prepared by Toronto and Region Conservation. September 2014. https://sustainabletechnologies.ca/app/uploads/2014/09/STEP-Bioretention-Report_2014.pdf
- ↑ Dietz, M.E. and J.C. Clausen. 2005. A field evaluation of rain garden flow and pollutant treatment. Water Air and Soil Pollution. Vol. 167. No. 2. pp. 201-208.
- ↑ Hunt, W.F. and W.G. Lord. 2006. Bioretention Performance, Design, Construction, and Maintenance. North Carolina Cooperative Extension Service Bulletin. Urban Waterways Series. AG-588-5. North Carolina State University. Raleigh, NC
- ↑ . Toronto and Region Conservation Authority. 2008. Performance Evaluation of Permeable Pavement and a Bioretention Swale, Seneca College, King City, Ontario. Prepared under the Sustainable Technologies Evaluation Program (STEP). Toronto, Ontario. https://sustainabletechnologies.ca/app/uploads/2013/03/PP_FactsheetSept2011-compressed.pdf
- ↑ Erickson, A.J., Gulliver, J.S., Weiss, P.T. 2012. Capturing phosphates with iron enhanced sand filtration. Water Research. 46(9). 3032-3042. https://www.sciencedirect.com/science/article/abs/pii/S0043135412001728
- ↑ Zhang, W., Brown, G.O., Storm, D.E., Zhang, H. 2008. Fly-ash amended sand as filter media in bioretention cells to improve phosphorus removal. Water Environment Research. 80(6). 507-516. https://onlinelibrary.wiley.com/doi/abs/10.2175/106143008X266823
- ↑ Kandel, S., Vogel, J., Penn, C., Brown, G. 2017. Phosphorus Retention by Fly Ash Amended Filter Media in Aged Bioretention Cells. Water. 9, 746. https://www.mdpi.com/2073-4441/9/10/746
- ↑ O'Neill, S.W., Davis, A.P. 2012a. Water treatment residual as a bioretention amendment for phosphorus. I. Evaluation studies. Journal of Environmental Engineering. 138(3). pp 318-327. https://ascelibrary.org/doi/10.1061/%28ASCE%29EE.1943-7870.0000409
- ↑ O'Neill, S.W., Davis, A.P. 2012b. Water treatment residual as a bioretention amendment for phosphorus. II. long-term column studies. Journal of Environmental Engineering. 138(3). pp 328-336. https://ascelibrary.org/doi/10.1061/%28ASCE%29EE.1943-7870.0000436
- ↑ Nabiul Afrooz, A.R.M., Boehm, A.B. 2017. Effects of submerged zone, media aging, and antecedent dry period on the performance of biochar-amended biofilters in removing fecal indicators and nutrients from natural stormwater. Ecological Engineering. 102. 320-330. https://www.sciencedirect.com/science/article/abs/pii/S0925857417301209
- ↑ Mohanty, S.K., Valenca, R., Berger, A.W., Yu, I.K.M., Xiong, X., Saunders, T.M., Tsang, D.C.W. 2018. Plenty of room for carbon on the ground: Potential applications of biochar for stormwater treatment. Science of the Total Environment. 625. 1644-1658. https://www.sciencedirect.com/science/article/abs/pii/S0048969718300378
- ↑ Sustainable Technologies Evaluation Program. 2018. Improving nutrient retention in bioretention. Technical Brief. https://sustainabletechnologies.ca/app/uploads/2019/06/improving-nutrient-retention-in-bioretention-tech-brief.pdf
- ↑ Davis, A., M. Shokouhian, H. Sharma and C. Minami. 2001. Laboratory . Study of Biological Retention for Urban Stormwater Management. Water Environment Research. 73(5): 5-14.
- ↑ Dietz, M.E. and J.C. Clausen. 2005. A field evaluation of rain garden flow and pollutant treatment. Water Air and Soil Pollution. Vol. 167. No. 2. pp. 201-208.
- ↑ Kim, H., Seagren, E.A., Davis, A.P. 2003. Engineered bioretention for removal of nitrate from stormwater runoff. Water Environment Research. 75(4). 335-367. https://onlinelibrary.wiley.com/doi/abs/10.2175/106143003X141169
- ↑ Brown, R.A., Hunt, W.F. 2011. Underdrain configuration to enhance bioretention exfiltration to reduce pollutant loads. Journal of Environmental Engineering. 137(11). 1082-1091. https://ascelibrary.org/doi/abs/10.1061/(ASCE)EE.1943-7870.0000437
- ↑ Wang, C., Wang, F., Qin, H., Zeng, X., Li, X. Yu, S. 2018. Effect of Saturated Zone on Nitrogen Removal Processes in Stormwater Bioretention Systems. Water. 10, 162. https://www.mdpi.com/2073-4441/10/2/162
- ↑ Roseen, R.M., Stone, R.M. 2013. Evaluation and Optimization of Bioretention Design for Nitrogen and Phosphorus Removal. U.S. Environmental Protection Agency. https://www3.epa.gov/region1/npdes/stormwater/research/epa-final-report-filter-study.pdf
- ↑ LeFevre, G.H., Paus, K.H., Natarajan, P., Gulliver, J.S., Novak, P.J., Hozalski, R.M. 2015. Review of Dissolved Pollutants in Urban Storm Water and Their Removal and Fate in Bioretention Cells. Journal of Environmental Engineering. 141(1). https://ascelibrary.org/doi/abs/10.1061/(ASCE)EE.1943-7870.0000876
- ↑ Canadian Council of Ministers of the Environment (CCME). 2002. Canadian water quality guidelines for the protection of aquatic life: Total particulate matter. In: Canadian Environmental Quality Guidelines, Canadian Council of Ministers of the Environment, Winnipeg
- ↑ Ontario Ministry of Environment and Energy (OMOEE), 1994. Policies, Guidelines and Provincial Water Quality Objectives of the Ministry of Environment and Energy. Queen’s Printer for Ontario. Toronto, ON.
- ↑ Clary, J., Jones, J., Leisenring, M., Hobson, P., Strecker, E. 2020. International Stormwater BMP Database: 2020 Summary Statistics. The Water Research Foundation. [https://www.waterrf.org/system/files/resource/2020-11/DRPT-4968_0.pdf
- ↑ Rusciano, G.M., Obropta, C.C. 2007. Bioretention Column Study: Fecal Coliform and Total Suspended Solids Reductions. Transactions of the ASABE. 50(4): 1261-1269. https://elibrary.asabe.org/abstract.asp??JID=3&AID=23636&CID=t2007&v=50&i=4&T=1
- ↑ Hunt, W.F., A.R. Jarrett, J.T. Smith, and L.J. Sharkey. 2006. Evaluating Bioretention Hydrology and Nutrient Removal at Three Field Sites in North Carolina. ASCE Journal of Irrigation and Drainage Engineering. 132(6): 600-608.
- ↑ . Performance Evaluation of Permeable Pavement and a Bioretention Swale, Seneca College, King City, Ontario. Prepared under the Sustainable Technologies Evaluation Program (STEP). Toronto, Ontario.
- ↑ Clary, J. Jones, Leisenring, M., Hobson, P., Strecker, E. 2020. International Stormwater BMP Database 2020 Statistical Summary. https://www.waterrf.org/system/files/resource/2020-11/DRPT-4968_0.pdf
- ↑ Peng, J., Cao, Y., Rippy, M.A., Nabuil Afrooz, A.R.M., Grant, S.B. 2016. Indicator and Pathogen Removal by Low Impact Development Best Management Practices. Water. 8. 600. https://www.mdpi.com/2073-4441/8/12/600
- ↑ Dagenais, D., Brisson, J. and Fletcher, T.D. 2018. The role of plants in bioretention systems; does the science underpin current guidance?. Ecological Engineering, 120, pp.532-545. http://www.phytotechno.com/wp-content/uploads/2018/10/Dagenais-2018-Bioretention.pdf
- ↑ Jones, M.P. and Hunt, W.F. 2009. Bioretention Impact on Runoff Temperature in Trout Sensitive Waters. Journal of Environmental Engineering. Vol. 135. No. 8. Pp. 577-585.