Low permeability soils
Introduction[edit]
The texture of native soils has a strong influence on the capacity of LID practices to reduce runoff volumes through infiltration. While sandy and silty sand soils have a high capacity to infiltrate water, fine textured soils containing a high percentage of clay may not be suitable for infiltration, or require design adaptations to promote sufficient infiltration.
Post-to-predevelopment water balance matching[edit]
The amount of infiltration required on a given site is determined by comparing water balance estimates before and after development. Ideally, the volume of water infiltrated and evapotranspired prior to development would remain the same afterwards. In practice, increased impervious cover normally results in lower post development evapotranspiration. Best efforts should be made to match pre-development water balance components. However, in some cases maintaining runoff volumes at predevelopment levels may require that more water is infiltrated after development than under the predevelopment condition.
Under natural conditions, sites with fine textured native soils will have lower infiltration volumes (and higher runoff) than those with coarse textured soils. On fine textured soils with very low permeability (hydrologic D type soils), the measured infiltration rate may even approach zero. Under these conditions, the stormwater management approach should focus on runoff prevention and volume reduction through evapotranspiration or water reuse, rather than infiltration.
Infiltration rate measurement methods[edit]
A variety of methods are available for measuring and estimating infiltration rates. Selecting an appropriate method will depend on the size and scale of the area over which infiltration rates are being determined.
LID design adaptations on low permeability soils[edit]
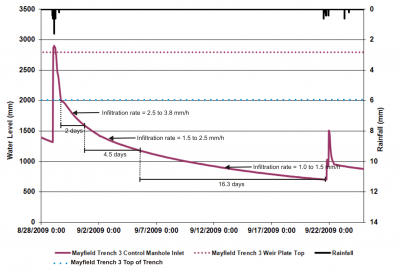
The rationale for variations in practice design for sites with fine textured soils is based on the relationship between hydraulic head and infiltration. As the head pressure in the Caledon infiltration trench decreased from 1.5 m to below 1 m, infiltration rates dropped from 2.5 - 3.8 mm/h during the first two days to only 1 - 1.5 mm hour after six and half days.
Infiltration is enhanced by maintaining a hydraulic head above the point at which infiltration slows to negligible levels. This means:
- Allowing water to remain within the storage reservoir below the underdrain or outlet continuously, or at least for longer time periods than the typical 48 to 92 hour drawdown time requirements for other stormwater BMPs, and
- Designing the storage to be more vertically oriented to increase available hydraulic head. BMPs should have higher side wall to bottom ratios, and a portion of the total storage regarded as effectively permanent.
Another important element of infiltration practice design in the context of fine textured soils relates to the attraction of soil surfaces to water, which are strong in fine textured clays and silty clays and weaker in coarse textured sands or sandy loams. This attraction, referred to as the matric potential, allows water to move up from the water table into the soils. The separation between the base of the infiltrating practice and the water table should be modelled and the effect of groundwater mounding taken into consideration.
Performance studies on fine textured soils[edit]
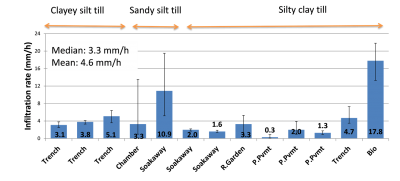
A number of field studies of LID practices have been conducted in southern Ontario on fine textured soils. Several of these studies have yielded data that allow for calculation of the facility wide infiltration rate during natural rain events of varying sizes:
- Infiltration rates on silty clay, clayey silt and sandy silt textured soils had a median value of 3.3 mm/h and a range between 0.3 and 17.8 mm/h.
- Permeable pavements had lower measured rates, in part due to compaction of the subsoils to accommodate traffic loading.
- Stormwater runoff volume reductions varied between sites, primarily due to factors other than the native soil infiltration rate. For instance, the infiltration trenches and chambers had similar native soil infiltration rates (3.1 to 5.1 mm/h), but runoff reduction values varying from 16 to 90%. This is attributed to differences in the I/P ratio, which ranged from 10:1 to 155:1.
- The configuration of the outflow was also an important consideration. In systems where the outlet is elevated above the native soil, runoff reduction levels tend to be considerably higher than systems with underdrains located at the native soil interface. See Bioretention: Performance
The studies, tabulated below, clearly indicate that significant volume reduction through infiltration is feasible on low permeability soils. If geotechnical investigations indicate that volume loss through infiltration is not possible, or would provide more limited benefits than found in these studies, the project should focus on reducing runoff through vegetative evapotranspiration. See here for a list of options, and their relative potential to reduce runoff through evapotranspiration.
| BMP type | Duration | Site characteristics | Runoff reduction (%) | ||
|---|---|---|---|---|---|
| Native soil | I/P ratio | Sump depth (m)* | |||
| Infiltration trench[1] | 2 growing seasons | Silty clay | 10:1 | 0.1; flow rate control | 80 |
| Bioretention[1] | 2 growing seasons | Silty clay | 10:1 | 0.1; flow rate control | 90 |
| Permeable Pavement[2] | 5 growing seasons | Silty clay | 1:1 | 0.1; flow rate control | 45 |
| Bioretention[3] | 1 growing season | Silty clay | 10:1 | 0.1; flow rate control | 83 |
| Bioretention [4] | 2 years | Silty clay | 11:1 | 0.1; flow rate control | 91 |
| Infiltration chamber[5] | 2 years | Sandy silt | 20:1 | 1.2 (approx.) | 90 |
| Infiltration trench[5] | 2 years | Clayey silt | 64:1 | 2 | 36 |
| Infiltration trench[5] | 2 years | Clayey silt | 155:1 | 2 | 16 |
| Exfiltration trench[6] | 2 years | Clay to clay silt till over silty sand till | 7:1 (approx.) | 0.65 | >90 |
| Infiltration trench[7] | 2 years | Silty sand with clayey silt deposits | 4:1 (approx.) | 1 | 89 |
| Permeable pavement + bioretention[8] | 4 years | Clayey silt on silt till | 6:1 (approx.) | 0.2-0.3 (approx.) | 80 |
| Bioretention[9] | 3 years | Silty clay | 10:1 (approx.) | 0.02 | 92 |
| Bioretention[10] | 3 years | Silty clay fill over clay till | 30:1 | 0.025 | 72 |
| Permeable pavement[10] | 3 years | Silty clay fill over clay till | 1:1 | 0.025 | 49 |
*Represents depth of sump below underdrain or overflow pipe. In some cases, a flow control device was installed to slow outflow rates and enhance infiltration
- ↑ 1.0 1.1 Van Seters, T. and Young, D., 2015, Performance Comparison of Surface and Underground Stormwater Infiltration Practices, TRCA, Toronto, Ontario
- ↑ Van Seters, T. and Drake, J., 2015, Five year evaluation of Permeable Pavements, TRCA, Toronto, Ontario
- ↑ STEP study ongoing (2017)
- ↑ Van Seters T and Graham C, 2014, Performance Evaluation of a Bioretention System, TRCA, Toronto, Ontario
- ↑ 5.0 5.1 5.2 Young D, Van Seters T, Graham, C, 2013,Evaluation of Underground Stormwater Infiltration Systems, TRCA, Toronto, Ontario
- ↑ SWAMP, 2005. Performance Assessment of a Perforated Pipe Stormwater Exfiltration system, TRCA, Toronto, Ontario
- ↑ SWAMP, 2002, Performance Assessment of a Swale Perforated Pipe Stormwater Infiltration System, TRCA, Toronto, Ontario
- ↑ Credit Valley Conservation, 2016, Elm Drive Low Impact Development Infrastructure Performance and Risk Assessment Technical Report, Mississauga Ontario
- ↑ Credit Valley Conservation, 2016, Lakeview Low Impact Development Infrastructure Performance and Risk Assessment Technical Report, Mississauga Ontario
- ↑ 10.0 10.1 Credit Valley Conservation, 2016, IMAX Low Impact Development Infrastructure Performance and Risk Assessment Technical Report, Mississauga Ontario

