Difference between revisions of "Green Roof: Life Cycle Costs"
| Line 37: | Line 37: | ||
#[[Enhanced swales|Enhanced Swales: Full Infiltration]] | #[[Enhanced swales|Enhanced Swales: Full Infiltration]] | ||
Material & Installation expenses represent the largest portion of total construction costs ( | Material & Installation expenses represent the largest portion of total construction costs (96%). | ||
==Life Cycle Costs== | ==Life Cycle Costs== | ||
Revision as of 16:37, 21 December 2022
Overview[edit]
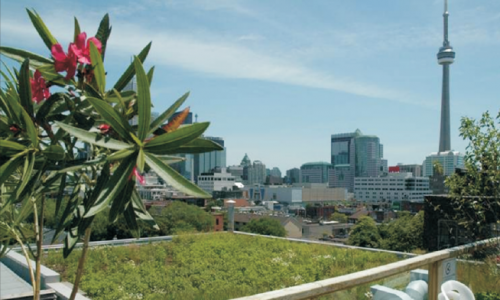
Green Roofs consist of a layer of vegetation and planting medium installed on top of a conventional flat or sloped roof. Green roofs are touted for their environmental benefits as they improve energy efficiency, reduce urban heat island effects and create greenspace for passive recreation and aesthetic enjoyment. They are also desirable for their water quality, water balance and peak flow control benefits. The green roof acts like a lawn or meadow by temporarily storing rainwater in the planting medium and ponding areas. Excess rainfall enters underdrains and overflow points and is conveyed to a storm sewer or other stormwater practice in the building drainage system. After a storm, a large portion of the stored water is evapo-transpired by the plants, evaporated or slowly drains away. STEP has prepared life cycle costs estimates for each design configuration, based on a 2,000 m2 road drainage area, runoff control target of 25 mm depth and 72 hour drainage period, for comparison which can be viewed below. To generate your own life cycle cost estimates customized to the development context, design criteria, and constraints applicable to your site, access the updated LID Life Cycle Costing Tool (LCCT) here.
Design Assumptions[edit]
Green roofs are an ideal technology for sites without significant space at ground level for infiltration and zero-lot line projects with outdoor amenity requirements. Green roofs are typically sized based on the available roof area, as opposed to treatment volume requirements. Green roofs are physically feasible in most development situations, but should be planned at the time of building design.
Design and operation and maintenance program assumptions used to generate cost estimates are based on tool default values and the following STEP recommendations:
- Native soil infiltration rates for Full, Partial and No Infiltration Design scenarios were assumed to be 20 mm/h, 10 mm/h and 2 mm/h, respectively, and a safety factor of 2.5 (where applicable) was applied to calculate the design infiltration rate.
- Operation and maintenance (O&M) cost estimates assume annual inspections, removal of trash and debris twice a year, watering, weeding, removal of litter, plant replacement and removal of weeds (where applicable). Verification inspections are included every 5 years to confirm adequate maintenance, and every 15 years to confirm adequate drainage performance through in-situ surface infiltration rate testing (where applicable)
- Load bearing capacity of building structure/roof deck need to be sufficient to support the saturated weight of the soil, vegetation and accumulated water.
- Green roofs may be installed on roofs with slopes up to 10%.
- Designed to capture precipitation falling directly onto the roof surface, not to receive runoff diverted from other source areas.
Notes[edit]
- The tool calculates costs for new (greenfield) development contexts and includes costs for contractor overhead and profit, material, delivery, labour, equipment (rental, operating and operator costs), hauling and disposal.
- Land value and equipment mobilization and demobilization costs are not included, assuming BMP construction is part of overall development site construction.
- Design and Engineering cost estimates are not calculated by the tool and must be supplied by the user.
- The tool adds 10% contingency and additional overhead as default.
- All cost estimates are in Canadian dollars and represent the net present value (NPV) as the tool takes into account average annual interest and discount rates over the 25 and 50 year operating life cycle periods.
- Unit costs are based on 2018 RSMeans standard union pricing.
- Additional costs associated with retrofit or redevelopment contexts is assumed to be 16% of the cost estimate for new (greenfield) construction contexts.
- Retrofit construction cost estimates are included in the 'Costs Summary' section for comparison.
- Retrofit construction cost estimates are included in the 'Costs Summary' section for comparison.
Construction Costs[edit]
Note: Please click on each image to enlarge to view associated construction cost estimates.
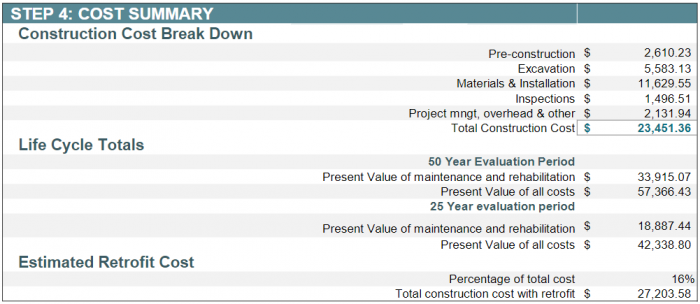
Above you can find a cost breakdown of a 2000m2 LID configuration:
Material & Installation expenses represent the largest portion of total construction costs (96%).
Life Cycle Costs[edit]
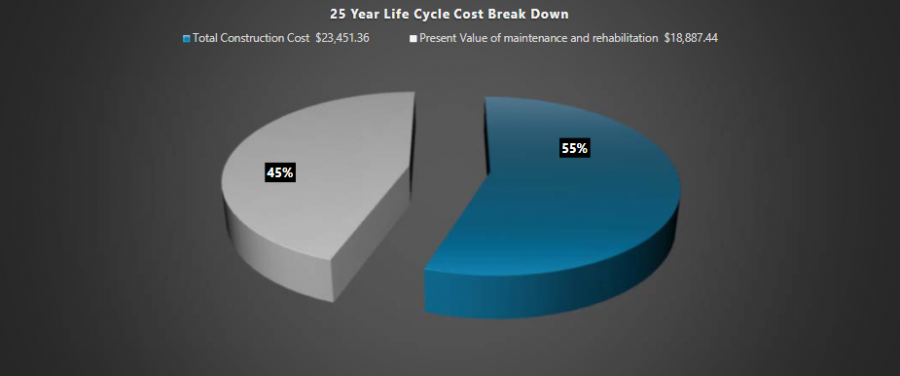
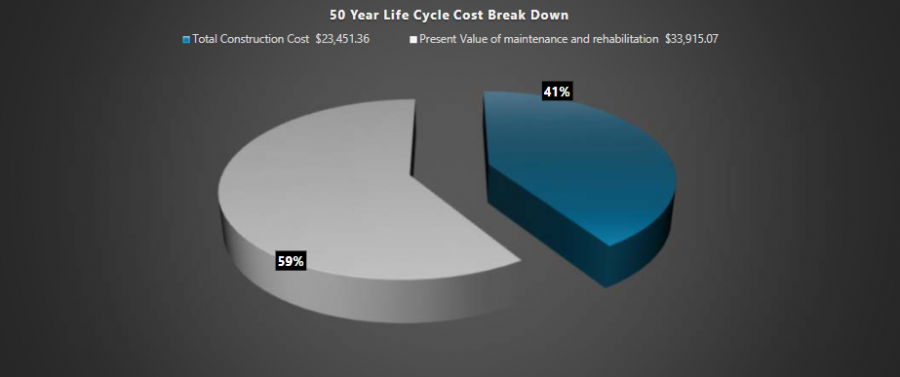
Below are capital and life cycle cost estimates for the Enhanced swales Full Infiltration configuration over 25- and 50-year time periods. The estimates of maintenance and rehabilitation (life cycle) costs represent net present values. Operation and maintenance costs are predicted to represent 45% of total life cycle costs over the 25-year evaluation period, and increase to 59% of total life cycle costs over the 50-year period, due to increased levels of litter removal, watering (establishment period - years 1 & 2 / annually and / drought watering) cleaning out and vacuuming of the catchbasin, mowing, replacement of sod, weeding and pruning of the BMP's planted vegetation.
25-Year life cycle cost break down[edit]
Note: Click on each image to enlarge to view associated life cycle cost estimate.
50-Year life cycle cost break down[edit]
Note: Click on each image to enlarge to view associated life cycle cost estimate.
Cost Summary Tables[edit]
Total life cycle cost estimates for the Enhanced swale Full Infiltration design configuration is ($23,451.36), makign it one of the cheapest LID BMP options.
It is notable that a sensitivity analysis was conducted in 2019 to compare construction cost estimates generated by the tool to actual costs of implemented projects. The analysis found that tool estimates were typically within ±14% of actual construction costs[2]
Full Infiltration[edit]
References[edit]
- ↑ STEP. 2007. AN ECONOMIC ANALYSIS OF GREEN ROOFS: Evaluating the costs and savings to building owners in Toronto and surrounding regions. ©Toronto and Region Conservation Authority. https://sustainabletechnologies.ca/app/uploads/2013/01/GR_Econ_Full-document.pdf
- ↑ Credit Vally Conservation (CVC). 2019. Life-cycle costing tool 2019 update: sensitivity analysis. Credit Valley Conservation, Mississauga, Ontario. https://sustainabletechnologies.ca/app/uploads/2020/04/LCCT-Sensitivity-Analysis_March2020.pdf

