Difference between revisions of "Testing"
| Line 356: | Line 356: | ||
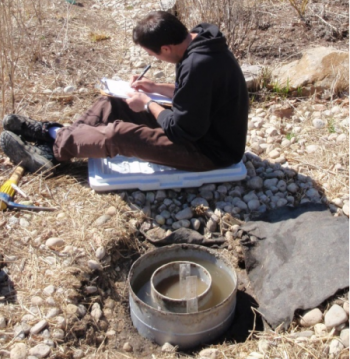
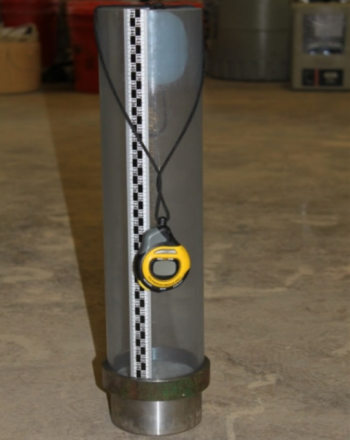
*The double-ring infiltrometer (See photo example - Source: TRCA, 2012) is made of two concentric tubes typically of thin metal or hard plastic, that are both continuously filled with water such that a constant water level is maintained as water infiltrates into the soil (ASTM International, 2005<ref>ASTM International. 2005. Sealed Double-Ring Infiltrometers for Estimating Very Low Hydraulic Conductivities. Volume 28, Issue 3. CODEN: GTJODJ. Published Online: 30 March 2005. DOI: 10.1520/GTJ12447. https://www.astm.org/gtj12447.html</ref>). The rate at which water is added to the centre tube is measured to determine the infiltration rate. For detailed guidance on how to perform the testing, refer to ASTM D3385-09 Standard Test Method for Infiltration Rate of Soils in Field Using Double-Ring Infiltrometer (ASTM International, 2018<ref>ASTM International. 2018. Standard Test Method for Infiltration Rate of Soils in Field Using Double-Ring Infiltrometer. Book of Standards Volume: 04.08. Published Online: 11 April, 2018. DOI: 10.1520/D3385-09. https://www.astm.org/d3385-09.html</ref>) and ASTM D5093-15 Standard Test Method for Infiltration Rate of Soils in Field Using Double-Ring Infiltrometer with Sealed-Inner Ring (ASTM International, 2018<ref>ASTM International. 2018. Standard Test Method for Field Measurement of Infiltration Rate Using Double-Ring Infiltrometer with Sealed-Inner Ring. Book of Standards Volume: 04.08 Published Online: 17 April, 2018. DOI: 10.1520/D5093-15. https://www.astm.org/d5093-15.html</ref> <br> | *The double-ring infiltrometer (See photo example - Source: TRCA, 2012) is made of two concentric tubes typically of thin metal or hard plastic, that are both continuously filled with water such that a constant water level is maintained as water infiltrates into the soil (ASTM International, 2005<ref>ASTM International. 2005. Sealed Double-Ring Infiltrometers for Estimating Very Low Hydraulic Conductivities. Volume 28, Issue 3. CODEN: GTJODJ. Published Online: 30 March 2005. DOI: 10.1520/GTJ12447. https://www.astm.org/gtj12447.html</ref>). The rate at which water is added to the centre tube is measured to determine the infiltration rate. For detailed guidance on how to perform the testing, refer to ASTM D3385-09 Standard Test Method for Infiltration Rate of Soils in Field Using Double-Ring Infiltrometer (ASTM International, 2018<ref>ASTM International. 2018. Standard Test Method for Infiltration Rate of Soils in Field Using Double-Ring Infiltrometer. Book of Standards Volume: 04.08. Published Online: 11 April, 2018. DOI: 10.1520/D3385-09. https://www.astm.org/d3385-09.html</ref>) and ASTM D5093-15 Standard Test Method for Infiltration Rate of Soils in Field Using Double-Ring Infiltrometer with Sealed-Inner Ring (ASTM International, 2018<ref>ASTM International. 2018. Standard Test Method for Field Measurement of Infiltration Rate Using Double-Ring Infiltrometer with Sealed-Inner Ring. Book of Standards Volume: 04.08 Published Online: 17 April, 2018. DOI: 10.1520/D5093-15. https://www.astm.org/d5093-15.html</ref> <br> | ||
*Accuracy is only moderate relative to permeameter methods (ASTM International, 2010<ref>ASTM International, 2010. Standard Test Methods for Measurement of Hydraulic Conductivity of Saturated Porous Materials Using a Flexible Wall Permeameter. Book of Standards Volume: 04.08. Published Online: 31 December, 2010. DOI: 10.1520/D5084-03. https://www.astm.org/d5084-03.html</ref>) and results tend to be biased towards higher values due to lateral flow. Potentially requires large volume of water and significant length of time for each measurement to reach steady state. | *Accuracy is only moderate relative to permeameter methods (ASTM International, 2010<ref name="example1">ASTM International, 2010. Standard Test Methods for Measurement of Hydraulic Conductivity of Saturated Porous Materials Using a Flexible Wall Permeameter. Book of Standards Volume: 04.08. Published Online: 31 December, 2010. DOI: 10.1520/D5084-03. https://www.astm.org/d5084-03.html</ref>) and results tend to be biased towards higher values due to lateral flow. Potentially requires large volume of water and significant length of time for each measurement to reach steady state. | ||
|[[File:Double ring infilt.PNG|350px]] | |[[File:Double ring infilt.PNG|350px]] | ||
|- | |- | ||
| Line 364: | Line 364: | ||
Science Society of America. Madison, WI. https://acsess.onlinelibrary.wiley.com/doi/book/10.2136/sssabookser5.1.2ed</ref>). For detailed guidance on how to perform the testing on permeable interlocking pavers, follow the procedure provided by ASTM C1781_C1781M – 15 (ASTM International, 2015<ref>ASTM International, 2015. Standard Test Method for Surface Infiltration Rate of Permeable Unit Pavement Systems. Book of Standards Volume: 04.05. Published Online: 27 December, 2018. DOI: 10.1520/C1781_C1781M-15. https://www.astm.org/c1781_c1781m-15.html</ref>). For pervious concrete or porous asphalt, follow the procedure provided by ASTM C1701_C1701M – 09 (ASTM International, 2009<ref>ASTM. 2009. Standard Test Method for Infiltration Rate of In Place Pervious Concrete. Book of Standards Volume: 04.02. Published Online: 17 March, 2017. DOI: 10.1520/C1701_C1701M-09. https://www.astm.org/c1701_c1701m-09.html</ref>). <br> | Science Society of America. Madison, WI. https://acsess.onlinelibrary.wiley.com/doi/book/10.2136/sssabookser5.1.2ed</ref>). For detailed guidance on how to perform the testing on permeable interlocking pavers, follow the procedure provided by ASTM C1781_C1781M – 15 (ASTM International, 2015<ref>ASTM International, 2015. Standard Test Method for Surface Infiltration Rate of Permeable Unit Pavement Systems. Book of Standards Volume: 04.05. Published Online: 27 December, 2018. DOI: 10.1520/C1781_C1781M-15. https://www.astm.org/c1781_c1781m-15.html</ref>). For pervious concrete or porous asphalt, follow the procedure provided by ASTM C1701_C1701M – 09 (ASTM International, 2009<ref>ASTM. 2009. Standard Test Method for Infiltration Rate of In Place Pervious Concrete. Book of Standards Volume: 04.02. Published Online: 17 March, 2017. DOI: 10.1520/C1701_C1701M-09. https://www.astm.org/c1701_c1701m-09.html</ref>). <br> | ||
*Accuracy for soil testing is only moderate relative to permeameter methods (ASTM International, 2010) and results tend to be biased towards higher values due to lateral flow. Potentially requires large volume of water and significant length of time for each measurement to reach steady state when used for soil testing. | *Accuracy for soil testing is only moderate relative to permeameter methods (ASTM International, 2010)<ref name="example1" />. and results tend to be biased towards higher values due to lateral flow. Potentially requires large volume of water and significant length of time for each measurement to reach steady state when used for soil testing. | ||
|[[File:Single ring.JPG|350px]] | |[[File:Single ring.JPG|350px]] | ||
|- | |- | ||
Revision as of 16:28, 9 May 2022
Section 8.2 - 8.9 content text (only) Appendix C as A SCROLLING DOCUMENT!!!
Mention training courses
Soil Characterization Testing[edit]
The soil component of an LID BMP contributes substantially to its stormwater treatment performance and overall function. If the soil is overly compacted or very finely textured, it may drain too slowly. If the soil is highly organic or contains excessive amounts of chemical fertilizer it may contribute to nutrient loads to receiving waters rather than reduce them. If the soil is too shallow it may not provide adequate treatment of contaminated stormwater or may not support healthy vegetation. Whether it be the engineered filter media of bioretention cells, the growing media of green roofs or the topsoil of enhanced swales, vegetated filter strips and soil amendment areas, it is important that the soil provide a healthy growing environment for plantings while being within design specifications for key parameters specific to the type of BMP.
It is most important to sample and test soil characteristics as a part of Construction and Assumption inspections, to confirm the BMP has been constructed with materials that meet design specifications and that installation of the soil component is acceptable. Testing to confirm that the material meets quality specifications (i.e., particle-size distribution, organic matter, pH, cationic exchange capacity, nutrients and soluble salts) needs to be completed prior to it being delivered to the construction site. Testing to confirm that installation of the soil component is acceptable (i.e., depth and compaction) should be performed after the installed material has been allowed to settle for at least two (2) weeks, and prior to planting.
Sampling and testing is also recommended as a part of Verification inspections, to determine if the BMP is being adequately maintained and if soil characteristics are still within acceptable ranges. It may also be done as part of Forensic inspection and Testing (FIT) work to help diagnose the cause of poor vegetation cover, drainage or treatment performance and decide on corrective actions.
LID BMP Type |
Soil Characteristic |
Acceptance Criteriai |
Test |
|---|---|---|---|
| Bioretention / Bioswales / Dry swale | |||
| Textureii | Loamy Sand or Sandy Loam; 70 to 88% sand-sized particles; 12 to 30% silt- and clay-sized particles; <20% clay-sized particles. | Particle-Size Distribution (PSD), or % Sand/Silt/Clay (i.e., Soil Texture) plus Sand Fraction | |
| Organic Matter (OM) | 3 to 10% by dry weightii | Walkley-Black method when OM <7.5% or Loss On Ignition (LOI) method when OM ≥7.5%iii | |
| Soil pH | 6.0 to 7.8 | pH of a Saturated Pasteiii | |
| Cationic Exchange Capacity (CEC) | >10 meq/100 g | Cationic Exchange Capacity Test | |
| Phosphorusiv | 12 to 40 ppm | Extractable Phosphorus | |
| Soluble Saltsv | ≤2.0 mS/cm (0.2 S/m) | Electrical Conductivity of a Soil-Water Slurry (2:1 water to soil ratio by volume)iii | |
| Depth | +/- 10% of design specification | Soil Cores, Test Pits or Cone Penetration Tests | |
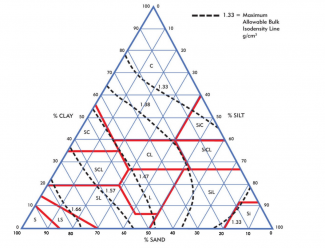
| Compactionvi | Surface Resistance: ≤110 PSI; Sub-surface Resistance: ≤260 PSI Bulk Density: ≤1.60 g/cm3 | Cone Penetration Tests or Bulk Density Tests | |
| Permeability | i ≥25 mm/h (KS ≥ 1 x 10⁻⁵ cm/s); and i ≤203 mm/h (KS ≤ 0.02 cm/s). | Surface Infiltration Rate Tests | |
| Enhanced swale (topsoil) | |||
| Texture | Same soil texture classification as specified in the final design or recorded on the as-built drawing | Particle-Size Distribution (PSD), or % Sand/Silt/Clay (i.e., Soil Texture) plus Sand Fraction | |
| Organic Matter (OM)ii | 5 to 10% by dry weight | Walkley-Black method when OM <7.5% or Loss On Ignition (LOI) method when OM ≥7.5%iii | |
| Soil pH | 6.0 to 7.8 | pH of a Saturated Pasteiii | |
| Phosphorusiv | 12 to 40 ppm | Extractable Phosphorus | |
| Soluble Saltsv | ≤2.0 mS/cm (0.2 S/m) | Electrical Conductivity of a Soil-Water Slurry (2:1 water to soil ratio by volume)iii | |
| Depth | +/- 10% of design specification | Soil Cores, Test Pits | |
| Compaction | Surface Resistance: ≤110 PSI; Sub-surface Resistance: Use soil texture class and "Soil & Texture Class Table" (below) to determine maximum acceptable value; Bulk Density: Use PSD to interpolate maximum bulk density value from bulk density figure beside this table. | Cone Penetration Tests or Bulk Density Tests | |
| Permeability | i ≥15 mm/h (KS ≥ 1 x 10⁻⁶ cm/s) | Surface Infiltration Rate Tests | |
| Vegetated filter strips and Soil Amendment Areas (topsoil) | |||
| Texture | Same soil texture classification as specified in the final design or recorded on the as-built drawing | Particle-Size Distribution (PSD), or % Sand/Silt/Clay (i.e., Soil Texture) plus Sand Fraction | |
| Organic Matter (OM)ii | 5 to 10% by dry weight | Walkley-Black method when OM <7.5% or Loss On Ignition (LOI) method when OM ≥7.5%iii | |
| Soil pH | 6.0 to 7.8 | pH of a Saturated Pasteiii | |
| Phosphorusiv | 12 to 40 ppm | Extractable Phosphorus | |
| Soluble Saltsv | ≤2.0 mS/cm (0.2 S/m) | Electrical Conductivity of a Soil-Water Slurry (2:1 water to soil ratio by volume)iii | |
| Compaction | Surface Resistance: ≤110 PSI; Sub-surface Resistance: Use soil texture class and "Soil & Texture Class Table" (below) to determine maximum acceptable value; Bulk Density: Use PSD to interpolate maximum bulk density value from bulk density figure beside this table. | Cone Penetration Tests or Bulk Density Tests | |
| Permeability | i ≥15 mm/h (KS ≥ 1 x 10⁻⁶ cm/s) | Surface Infiltration Rate Tests | |
| Green roof (growing media) | |||
| Texture | See product vendor or BMP designer for specifications | Particle-Size Distribution (PSD), or % Sand/Silt/Clay (i.e., Soil Texture) plus Sand Fraction | |
| Maximum Media Density | See product vendor or BMP designer for specification | Maximum Media Density Test (ASTM E2399/E2399M-15) | |
| Water Storage Capacityvii | Extensive: ≥35% by volume / Intensive: ≥45% by volume | Both part of Maximum Media Density Test (ASTM E2399/E2399M-15) | |
| Air-Filled Porosityvii | ≥10% by volume | Part of Maximum Media Density Test (ASTM E2399/E2399M-15) | |
| Permeability, Saturated Media | See product vendor or BMP designer for specification | Part of Maximum Media Density Test (ASTM E2399/E2399M-15) | |
| Organic Matter | See product vendor or BMP designer for specification | Walkley-Black method when OM <7.5% or Loss On Ignition (LOI) method when OM ≥7.5%iii | |
| Soil pHviii | 6.5 to 7.8 | pH of a Saturated Paste | |
| Soluble Saltsviii | ≤0.85 mS/cm (0.085 S/m) | Electrical Conductivity of a Saturated Media Extract (SME)solution | |
| Phosphorusix | 2.2 to 40 ppm | Electrical Conductivity of a Saturated Media Extract (SME)solution |
| Notes |
|---|
| i Values represent acceptable ranges for established BMPs (i.e., in operation for 3 years or more). For Construction and Assumption inspections, final design and soil or media product specifications and permissible tolerance ranges should be used as the acceptance criteria, which may be smaller ranges than the values in this table. |
| ii Suggested range for diagnosing suspected problems with drainage function, vegetation cover or vegetation condition for established BMPs constructed with filter media that meets recommended guidelines (CVC & TRCA, 2010)[2]. For proprietary filter media products, different ranges may be acceptable. Product specifications should be provided by the media supplier. Test results should be compared to the media supplier’s specifications and permissible tolerance ranges |
| iii Based on Ontario Ministry of Food and Rural Affairs’ Soil Fertility Handbook guidance on soil fertility testing for crop production (OMAFRA, 2006)[3]. |
| iv Based on Minnesota Pollution Control Agency (MPCA, 2015) for minimum to sustain plant growth and Ontario Ministry of Agriculture, Food and Rural Affairs (OMAFRA, 2014) for a maximum to avoid unnecessary fertilization that would have low or no effect on plant health. |
| v Based on the threshold for non-saline soils (Whitney, 2012). |
| vi Interpolated value from bulk density figure beside this table. based on a sandy loam soil containing at least 70% sand-sized particles. |
| vii Based on German green roof standards (FLL 2008). Specifications will vary depending on the green roof growing media product. Product specifications should be provided by the media supplier. Test results should be compared to the media supplier’s specifications and permissible tolerance ranges. |
| viii Based on Penn State University Center for Green Roof Research (Berghage et al. 2008). |
| ix Based on Penn State University Center for Green Roof Research (Berghage et al. 2008) for the minimum to sustain plant growth and Ontario Ministry of Agriculture, Food and Rural Affairs (OMAFRA, 2014) for the maximum to avoid unnecessary fertilization that would have low or no effect on plant health. |
Surface Resistancei |
'Sub-surface Resistancei | ||
|---|---|---|---|
| All Soil Textures | Sandy (includes loamy sand, sandy loam, sandy clay loam and sandy clay) | Silty (includes loam, silty loam, silty clay loam, and silty clay) | Clayey (includes clay loam and clay) |
| ≤ 110 PSIii | ≤ 260 PSI | ≤ 260 PSI | ≤ 225 PSI |
| ≤ 7.7 kg/cm2 | ≤ 18.3 kg/cm2 iii | ≤ 18.3 kg/cm2 | ≤ 15.8 kg/cm2 |
| ≤ 758 kPaiv | ≤ 1793 kPa | ≤ 1793 kPa | ≤ 1551 kPa |
| Notes |
|---|
| i Adapted from Gugino et al. (2009)[4] |
| ii PSI = pounds per square inch (lb/in2) |
| iii kg/cm2 = kilogram per square centimetre. |
| iv kPa = kilopascals |
For further information regarding soil characteristics, acceptance criteria per LID BMP type and associated testing tools and protocols scroll down to the embedded 2016 guide below.
Sediment Accumulation Testing[edit]
A primary function of LID BMPs is to capture and retain sediment, trash and debris that are suspended in stormwater runoff. Over time, sediment and natural debris accumulates in certain portions of a BMP, particularly in pretreatment devices (e.g., forebays, gravel diaphragms, hydrodynamic separators, vegetated filter strips, grass swales, catchbasin/manhole sumps) and at inlets, where inflowing runoff is slowed down and spread out, which promotes sedimentation of suspended materials by design.
Without adequate inspection and maintenance (at least annually), accumulated sediment and debris in pretreatment devices and inlets can inhibit the flow of stormwater into the BMP or be transported onto the filter bed . Extensive sediment accumulation on the surface of a filter bed will eventually lead to drainage problems due to clogging of the filter media with fine-textured sediment. When sediment accumulation on the surface of a filter strip or swales becomes excessive the BMPs begin to export sediment and associated pollutants into receiving waters rather than retain them.
Key Components, Test Methods and Equipment[edit]
Key components of LID BMPs that should be the subject of sediment accumulation testing (i.e., depth measurements) are described in the table below along with recommended test methods. Depth measurements should be recorded on inspection field data forms provided on each associated BMP's I&M page on the wiki, used to determine if sediment removal maintenance is needed.
LID BMP Type |
Key Components |
Recommended Test Method |
|---|---|---|
| Bioretention / Bioswales / Dry swale / Enhanced grass swales / Vegetated filter strips | ||
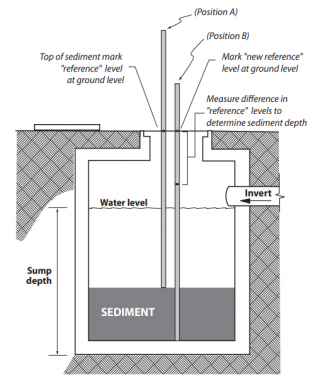
| Inlets; Pretreatment devices | Use a tape measure or probe to measure the depth from the bottom elevation of the pretreatment device or surface of the filter bed (adjacent to the inlet structure), below any stone or mulch cover present, to the highest elevation of accumulated sediment present. For catchbasins, manholes and hydrodynamic separator pretreatment devices a sludge sampler (e.g., “sludge judge” sampler) should be used to sample the sediment and estimate depth accumulated in sumps. Record the measurement and remove the sediment if it exceeds trigger values for follow-up action. | |
| Filter Bed | Use a tape measure or probe to measure sediment depth from the surface of the filter bed, below any stone or mulch cover present, to the elevation of accumulated sediment present in at least five (5) locations evenly distributed over the filter bed surface area. Record the measurements, calculate the mean sediment depth and compare to trigger values to determine if follow-up/corrective actions are needed. | |
| Underground infiltration systems (Soakaways, infiltration trenches, infiltration chambers and perforated pipe storm sewer systems | ||
| Inlets; Pretreatment devices | Use tape measure or probe to measure the depth from the bottom elevation of the inlet pipe or pretreatment device, below any stone or mulch cover present, to the highest elevation of accumulated sediment present. For catchbasins, manholes and hydrodynamic separator pretreatment devices a sludge sampler (e.g., “sludge judge” sampler) should be
used to sample the sediment and estimate depth accumulated in sumps. A measuring tape or staff gauge installed in the structure and set to the bottom elevation can provide another means of tracking sediment accumulation. Record the measurement and remove the sediment if it exceeds trigger values. | |
| Filter Bed | (Applicable to vault-type infiltration chamber systems only) - Use a tape measure or probe to measure sediment depth from the surface of the gravel bed to the elevation of
accumulated sediment in at least five (5) locations evenly distributed over the bed surface area. Record the measurements, calculate the mean sediment depth and compare to trigger values to determine if follow-up/corrective actions are needed. | |
| Cisterns (Rainwater Harvesting & Rain barrels) | ||
| Cistern | From outside the cistern use a tape measure or probe to measure the depth from a fixed point (e.g., rim of the access hatch) to the bottom elevation of the cistern and to the highest elevation of accumulated sediment present. Subtract the two values to calculate the sediment depth. A sludge sampler (e.g., “sludge judge” sampler) may also be used to sample the sediment and estimate depth. A staff gauge installed on the cistern wall and set to the bottom elevation provides another means of measuring sediment depth that does not require entry into the confined space. Record the measurement and remove the sediment if it exceeds trigger values for follow-up action. |
Standard Equipment Used[edit]
Equipment needed for sediment accumulation testing can include the following:
- Safety apparel (hard hat, steel toed boots, gloves and eye protection)
- Safety cones or barriers (for restricting access around open hatches/grates/manhole covers)
- Clipboard, inspection field data forms, pens
- Pick shovel (for opening catchbasin grates or manhole covers)
- Measuring tape
- Probe (rigid)
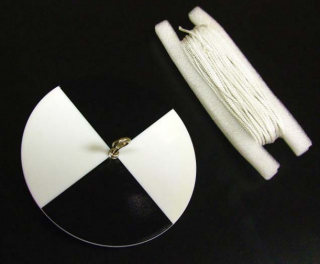
- Secchi disk
- Sludge sampler
- Rope
- Flashlight or headlamp
- Harness
- Tripod (certified and tested)
- Winch (certified and tested)
- Multi-gas detector (recently calibrated and tested)
Sediment accumulation testing should be conducted frequently during construction (e.g., weekly and after any storm event of 15 mm depth or greater), as part of Assumption inspection work, once construction is fully completed and sediment accumulated on the CDA, in conveyances (e.g., gutters, catchbasins, storm sewers) and pretreatment devices has been removed, and as part of Routine Operation and Verification inspections.
For further information regarding soil characteristics, acceptance criteria per LID BMP type and associated testing tools and protocols scroll down to the embedded 2016 guide below.
Surface Infiltration Rate Testing[edit]
For LID BMPs like bioretention and bioswales, enhanced swales, vegetated filter strips and permeable pavements, the rate at which stormwater infiltrates through the BMP surface greatly affects its drainage performance. If the surface infiltration rate (i) is too low, inflowing stormwater will quickly begin to pond on the surface and, once the overflow outlet elevation is reached, will by-pass treatment by the BMP. In extreme cases the BMP may pond water on the surface for longer than 24 hours, creating nuisance conditions (e.g., poor vegetation cover, ice formation, ideal mosquito breeding ground habitat).
Causes of excessively low surface infiltration rates include use of soil during construction that does not meet design specifications, accumulation of fine sediment on the soil surface or in permeable pavement joints or pore spaces, and over-compaction of the soil, that can occur during construction or routine operation. Therefore it is important to test the surface infiltration rate of LID BMPs as part of Assumption and Verification inspections. As part of Assumption inspections it helps determine if the BMP is ready to be assumed by the property owner. As part of Verification inspections it provides an indication of whether or not the surface drainage performance of the BMP is still within an acceptable range, if it is being adequately maintained, and to diagnose the cause of any problems with drainage or vegetation detected through visual inspection or other types of testing. Tests may also be done as part of Forensic Inspection and Testing (FIT) work to diagnose the cause of problems with drainage or vegetation, with the number and locations of test determined by the nature of the problem being investigated.
Surface infiltration rate testing involves estimating the saturated hydraulic conductivity (KS) of the BMP surface through measurement at several locations and calculation of an average value. A single measurement can take anywhere from 15 minutes to several hours (Erickson et al., 2013[7]) depending on soil or surface characteristics.
Filter Bed Surface Infiltration Rate[edit]
To evaluate surface infiltration rate using a surface ponding well during a simulated storm event, the filter media bed should be thoroughly wetted prior to the test. Measurements of filter bed drainage rate and corresponding estimates of surface infiltration rate should be made following natural or simulated storm events that deliver enough water to the BMP to pond at least 75 mm of water on the surface of the filter media bed, in an effort to consistently approximate saturated soil flow conditions.
Calculation[edit]
Filter Bed Surface Infiltration Rate: = 50 / ΔT50
Where
ΔT50 = Time to drain last 50 mm of surface ponded water
ΔT50 = (T2 – T1) x 24
T1 = Post-storm date and time (mm/dd/yyyy hh:mm:ss) when surface ponding water level reaches 50 mm in depth.
T2 = Post-storm date and time (mm/dd/yyyy hh:mm:ss) when surface ponding is fully drained
BMP Components and Test Methods[edit]
Key components of LID BMPs that should be the subject of surface infiltration rate testing are described in the table below along with recommended test methods.
LID BMP Type |
Key Components |
Recommended Test Method |
|---|---|---|
| Bioretention / Bioswales / Dry swale / Enhanced grass swales / Vegetated filter strips | ||
| Filter bed surface | Use an infiltrometer or permeameter to measure field saturated hydraulic conductivity (KS) in at least 5 locations or at a rate of one measurement for every 25 m2 of filter bed surface area, including inlet and lowest elevation areas. Compare mean and individual values to the design specification or trigger value (See Triggers for follow-up and corrective actions below) to determine if follow-up tasks are needed. | |
| Permeable pavement | ||
| Pavement surface | Use a single-ring infiltrometer to measure field saturated hydraulic conductivity (KS) in at least 5 locations or at a rate of one measurement for every 250 m2 of pavement surface area, evenly distributed. For permeable interlocking pavers, follow the procedure provided by ASTM C1781_C1781M – 15 (ASTM International, 2015[8]). For pervious concrete or porous asphalt, follow the procedure provided by ASTM C1701_C1701M – 09 (ASTM International, 2009[9]). Compare mean and individual values to the design specification or trigger value (See Triggers for follow-up and corrective actions below) to determine if follow-up tasks are needed. |
Common Methods for Surface Infiltration Rate Testing[edit]
Method |
Description |
Photo Example |
|---|---|---|
| Double Ring Infiltrometer (constant head) |
|
|
| Single Ring Infiltrometer (constant or falling head) |
|

|
| Modified Philip Dunne Infiltrometer (falling head) |
|
|
| Guelph Permeameter with Tension Disk (constant head) |
|
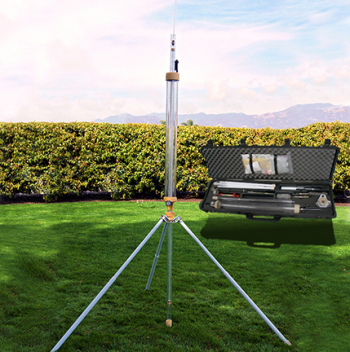
|
| Tension Infiltrometer (constant or falling head) |
|
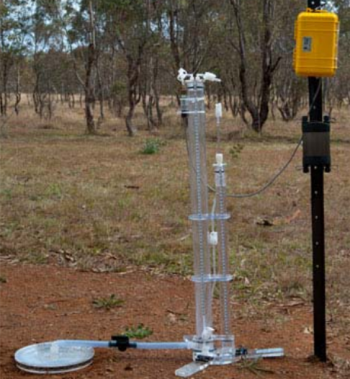
|
Standard Equipment Used[edit]
Equipment needed for surface infiltration rate testing will vary depending on the chosen test method (constant head and falling head methods) but can include the following:
- Safety apparel (steel toed boots)
- Safety cones or barriers (for restricting access when testing permeable pavements)
- Clipboard, inspection field data forms, pens
- Testing instrument (e.g., infiltrometer or permeameter) and instruction manual
- Stopwatch
- Water reservoir (e.g., truck mounted tank or cistern filled with water)
- Buckets or jugs (for filling the instrument)
- Plastic graduated cylinder (for measuring volume of water added during constant head infiltrometer tests)
- Soil moisture probe
- Fine sand (for even contact between Tension infiltrometer and soil surface)
For further information regarding soil characteristics, acceptance criteria per LID BMP type and associated testing tools and protocols scroll down to the embedded 2016 guide below.
Natural or Simulated Storm Event Testing[edit]
Continuous Monitoring[edit]
Green Roof Irrigation System Testing[edit]
Green Roof Leak Detection Testing[edit]
Cistern Pump Testing[edit]
Embedded Reference Guide[edit]
To gain further insight into various testing requirements/methods, acceptance requirements, associated tools, equipment and components from STEP on the inspection and maintenance of different BMP LID practices, please see our complete guide here or embedded below:
References[edit]
- ↑ Sustainable Sites Initiative. 2009. The Sustainable Sites Initiative: Guidelines and Performance Benchmarks. American Society of Landscape Architects, Lady Bird Johnson Wildflower Center at The University of Texas at Austin, United States Botanic Garden and Sustainable Sites Initiative, Austin, TX. https://digital.library.unt.edu/ark:/67531/metadc31157/
- ↑ CVC and TRCA, 2010. Low Impact Development Stormwater Management Planning and Design Guide. Version 1.0. https://cvc.ca/wp-content/uploads/2014/04/LID-SWM-Guide-v1.0_2010_1_no-appendices.pdf
- ↑ OMAFRA. 2006. Soil Fertility Handbook Publication 611. Guelph, Ontario, Canada. http://www.omafra.gov.on.ca/english/crops/pub611/pub611.pdf.
- ↑ Gugino, B.K., Idowu, O.J., Schindelbeck, R.R., van Es, H.M., Wolfe, D.W., Moebius, B.N., Thies, J.E., and Abawi, G.S. 2009. Cornell Soil Health Assessment Training Manual, Edition 2.0, 2009, Cornell University, College of Agriculture and Life Sciences, New York State Agricultural Experiment Station(NYSAES), Geneva, New York. ISBN 0-9676507-4-7. https://www.canr.msu.edu/foodsystems/uploads/files/cornell_soilhealth.pdf
- ↑ Wildco. 2018. Secchi Disk Kit, Fieldmaster®. Accesses May 5 2022: https://shop.sciencefirst.com/wildco/student-water-samplers/5979-fieldmaster-student-secchi-disk-non-calibrated-line-for-student-use-only-200mm.html
- ↑ King County. 2010. Tips for Successful Drainage Facility Self-Inspection. Department of Natural Resources and Parks. File Name: 0906_DrainTIPS.indd lpre. Developed: June, 2010. https://www.seatacwa.gov/home/showpublisheddocument/31441/637662770980630000
- ↑ Erickson, A.J., Weiss, P.T., Gulliver, J.S. 2013. Optimizing Stormwater Treatment Practices: A Handbook of Assessment and Maintenance. New York: Springer. https://link.springer.com/book/10.1007/978-1-4614-4624-8
- ↑ ASTM International. 2015. ASTM C1781/C1781M-15 - Standard Test Method For Surface Infiltration Rate Of Permeable Unit Pavement Systems. Accessed May 5 2022: https://webstore.ansi.org/Standards/ASTM/astmc1781c1781m15
- ↑ ASTM International. 2009. ASTM C1701/C1701M-09 - Standard Test Method for Infiltration Rate of In Place Pervious Concrete. Accessed May 5 2022: https://www.astm.org/c1701_c1701m-09.html
- ↑ ASTM International. 2005. Sealed Double-Ring Infiltrometers for Estimating Very Low Hydraulic Conductivities. Volume 28, Issue 3. CODEN: GTJODJ. Published Online: 30 March 2005. DOI: 10.1520/GTJ12447. https://www.astm.org/gtj12447.html
- ↑ ASTM International. 2018. Standard Test Method for Infiltration Rate of Soils in Field Using Double-Ring Infiltrometer. Book of Standards Volume: 04.08. Published Online: 11 April, 2018. DOI: 10.1520/D3385-09. https://www.astm.org/d3385-09.html
- ↑ ASTM International. 2018. Standard Test Method for Field Measurement of Infiltration Rate Using Double-Ring Infiltrometer with Sealed-Inner Ring. Book of Standards Volume: 04.08 Published Online: 17 April, 2018. DOI: 10.1520/D5093-15. https://www.astm.org/d5093-15.html
- ↑ Jump up to: 13.0 13.1 ASTM International, 2010. Standard Test Methods for Measurement of Hydraulic Conductivity of Saturated Porous Materials Using a Flexible Wall Permeameter. Book of Standards Volume: 04.08. Published Online: 31 December, 2010. DOI: 10.1520/D5084-03. https://www.astm.org/d5084-03.html
- ↑ Werner, A. 2010. File:Single ring.JPG. Original upload December 21, 2005. Author: Soil Physics at English Wikipedia. https://commons.wikimedia.org/wiki/File:Single_ring.JPG.
- ↑ Klute, A. 1986. Methods of soil analysis, Part I. Physical and mineralogical methods, 2nd edition. Soil Science Society of America. Madison, WI. https://acsess.onlinelibrary.wiley.com/doi/book/10.2136/sssabookser5.1.2ed
- ↑ ASTM International, 2015. Standard Test Method for Surface Infiltration Rate of Permeable Unit Pavement Systems. Book of Standards Volume: 04.05. Published Online: 27 December, 2018. DOI: 10.1520/C1781_C1781M-15. https://www.astm.org/c1781_c1781m-15.html
- ↑ ASTM. 2009. Standard Test Method for Infiltration Rate of In Place Pervious Concrete. Book of Standards Volume: 04.02. Published Online: 17 March, 2017. DOI: 10.1520/C1701_C1701M-09. https://www.astm.org/c1701_c1701m-09.html
- ↑ Ahmed, F., Gulliver, J.S. and Nieber, J.L. 2011. Performance of low impact development practices on stormwater pollutant load abatement. https://www.researchgate.net/publication/283326958_Performance_of_Low_Impact_Development_Practices_on_Stormwater_Pollutant_Load_Abatement
- ↑ Hoskin Scientific Ltd. 2022. Guelph Permeameter Kit. https://www.hoskin.ca/catalog/index.php?main_page=product_info&cPath=1_59_67_3677&products_id=5082
- ↑ ICT International. n.d. Determination of Soil Unsaturated Hydraulic Conductivity. https://www.ictinternational.com/casestudies/determination-of-soil-unsaturated-hydraulic-conductivity/

