Difference between revisions of "Low Impact Development Life Cycle Costing Tool"
Dean Young (talk | contribs) |
|||
| (16 intermediate revisions by 2 users not shown) | |||
| Line 25: | Line 25: | ||
You can find practice-specific life cycle cost estimates for each LID BMP type listed below. Each page provides a brief overview of the design assumptions and summarizes net present value estimates of construction, and life cycle operation and maintenance costs over 25 and 50 year timeframes, in Canadian dollars. | You can find practice-specific life cycle cost estimates for each LID BMP type listed below. Each page provides a brief overview of the design assumptions and summarizes net present value estimates of construction, and life cycle operation and maintenance costs over 25 and 50 year timeframes, in Canadian dollars. | ||
To read more about the specific design | To read more about the specific design, operation and maintenance assumptions for each estimate, please see below: | ||
*[[ | *[[Bioretention: Life Cycle Costs]] | ||
*[[ | *[[Permeable pavements: Life Cycle Costs]] | ||
*[[ | *[[Porous Asphalt: Life Cycle Costs]] | ||
*[[ | *[[Infiltration Trench: Life Cycle Costs]] | ||
*[[ | *[[Infiltration Chamber: Life Cycle Costs]] | ||
*[[ | *[[Enhanced Swales: Life Cycle Costs]] | ||
*[[ | *[[Rainwater Harvesting Cistern: Life Cycle Costs]] | ||
*[[Vegetated Filter Strip: Life Cycle Costs]] | |||
*[[Green Roof: Life Cycle Costs]] | |||
<small>'''Note''': All practice cost estimates are based on a Contributing Drainage Area (CDA) of 2000 m<sup>2</sup>, runoff retention or treatment | <small>'''Note''': All practice cost estimates are based on a Contributing Drainage Area (CDA) of 2000 m<sup>2</sup>, runoff control target of 25 mm depth (retention or treatment), and a drainage period of 72 hours. For infiltration practices, native soil infiltration rates for Full, Partial and No Infiltration Design scenarios were assumed to be 20 mm/h, 10 mm/h and 2 mm/h, respectively, and a safety factor of 2.5 was applied to calculate the design infiltration rate. Construction cost estimates assume the practice is built as part of an overall greenfield site construction project so do not include land value, equipment mobilization/demobilization costs, nor additional costs associated with retrofit/redevelopment scenarios. Operation and maintenance (O&M) cost estimates assume annual inspections, removal of trash and debris twice a year, removal of sediment from pretreatment structures annually, and removal of weeds twice a year (where applicable). Verification inspections are included every 5 years to confirm adequate maintenance, and every 15 years to confirm adequate drainage performance through in-situ surface infiltration rate testing (where applicable).</small> | ||
==Comparison of Life Cycle Costs by BMP Type== | ==Comparison of Life Cycle Costs by BMP Type== | ||
The following bar charts compare construction and life cycle cost estimates by LID BMP type for three main design scenarios: Full Infiltration Design; Partial Infiltration Design; and No Infiltration Design. Design and O&M assumptions for each BMP type and | The following bar charts compare construction and life cycle cost estimates by LID BMP type for three main design scenarios: Full Infiltration Design; Partial Infiltration Design; and No Infiltration Design. Design and O&M assumptions for each BMP type and scenario are as indicated in the above note. All cost estimates generated by the LCCT have been divided by 2000 m<sup>2</sup> to produce values in Canadian dollars per square metre (CAD$/m<sup>2</sup>) of Contributing Drainage Area. Cost estimates for a 2000 m<sup>2</sup> asphalt parking lot serviced by two catch basins and an oil and grit separator (OGS) are also provided for comparison. | ||
Construction Cost Comparisons: | ===Construction Cost Comparisons:=== | ||
Life Cycle Cost Comparisons: | [[File:C.C 25mm Retention Full.png|thumb|right|400px|'''Construction Costs Per Unit Drainage Area (CAD$/m<sup>2</sup>) - Full Infiltration Design, 25 mm Retention''']] | ||
[[File:C.C 25mm Retention Partial Infiltration.png|thumb|left|400px|'''Construction Costs Per Unit Drainage Area (CAD$/m<sup>2</sup>) - Partial Infiltration Design, 25 mm Retention''']] | |||
[[File:C.C 25mm Retention No Infiltration.png|thumb|center|400px|'''Construction Costs Per Unit Drainage Area (CAD$/m<sup>2</sup>) - No Infiltration Design, 25 mm Treatment''']]</br> | |||
<small>'''Note:''' Click on each image to enlarge to view associated construction cost comparison results.</small><br> | |||
===Life Cycle Cost Comparisons:=== | |||
[[File:LCCT 25mm Retention Full.png|thumb|right|400px|'''Life Cycle Costs Per Unit Drainage Area (CAD$/m<sup>2</sup>) - Full Infiltration Design, 25 mm Retention''']] | |||
[[File:LCCT 25mm Retention Partial infiltration.png|thumb|left|400px|'''Life Cycle Costs Per Unit Drainage Area (CAD$/m<sup>2</sup>) - Partial Infiltration Design, 25 mm Retention''']] | |||
[[File:LCCT 25mm Retention No infiltration.png|thumb|center|400px|'''Life Cycle Costs Per Unit Drainage Area (CAD$/m<sup>2</sup>) - No Infiltration Design, 25 mm Treatment''']]<br> | |||
<small>'''Note:''' Click on each image to enlarge to view associated life cycle cost comparison results.</small><br> | |||
==References== | ==References== | ||
Latest revision as of 16:11, 21 December 2022
Overview[edit]
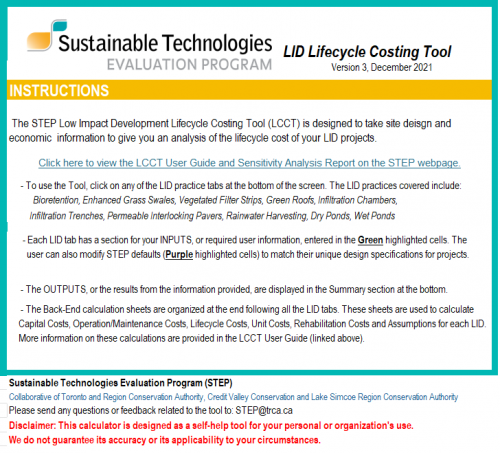
Accurately estimating the life cycle costs for low impact development (LID) practices can be a complicated process. The LID Life Cycle Costing Tool (LCCT) helps make this process easier and allows users to produce realistic cost estimates based on user-specified LID design and operation and maintenance assumptions. The LCCT provides cost estimates for the construction, inspection, and maintenance of LID stormwater practices over 25 and 50 year timeframes.
Originally released in 2013, the most recent version of the Excel-based tool (Version 3.0) includes the following new features and updates:
- Increased transparency and usability. Users can now access the tool’s back-end to modify assumptions, unit costs, design defaults, etc.
- Porous asphalt was added as an LID practice. Additionally, this tab allows for including conventional asphalt in the contributing drainage area up to a 1:1 impermeable to permeable area ratio.
- Cost estimation for dry ponds has been added to LID practices. Wet ponds are also included as a traditional stormwater management strategy in order to facilitate direct comparisons with LID.
- Updated line costs to 2018 based on RS Means data and information obtained through consultation with suppliers and project managers.
- Refined algorithms to reflect line cost updates and construction practices (i.e., bioretention sizing algorithm based on latest guidance).
- Added a land value option to all BMPs. This allows users to account for land acquisition when required and for opportunity costs when otherwise developable land is used for stormwater management.
- Updated maintenance task schedules using “discretionary maintenance options” and defaults that were based on observations in the field.
- Added a costing curve development module that enables users to develop their own costing curves to be input into the LID-TTT.
- A sensitivity analysis that uses constructed projects to test the tool’s accuracy.
- An LCCT user guide provides a brief introduction to the tool and a demonstration of how it can be used to suit their purposes.
- The LID practices evaluated in the report include bioretention cells, permeable pavement, infiltration trenches and infiltration chambers, enhanced swales, rainwater harvesting and green roofs. bioswales and perforated pipe systems or exfiltration trenches were considered to be similar to bioretention and infiltration trenches, respectively, and therefore were not evaluated as separate practices. The tool does not assess LID-related cost savings related to improved aesthetics, air quality, community livability and other public benefits, as these savings are best evaluated in relation to specific case study examples.
STEP encourages feedback on the LCCT from users and they can provide them below on this page or here at the team's email address: STEP@trca.ca
Practice-specific Life Cycle Costs[edit]
You can find practice-specific life cycle cost estimates for each LID BMP type listed below. Each page provides a brief overview of the design assumptions and summarizes net present value estimates of construction, and life cycle operation and maintenance costs over 25 and 50 year timeframes, in Canadian dollars.
To read more about the specific design, operation and maintenance assumptions for each estimate, please see below:
- Bioretention: Life Cycle Costs
- Permeable pavements: Life Cycle Costs
- Porous Asphalt: Life Cycle Costs
- Infiltration Trench: Life Cycle Costs
- Infiltration Chamber: Life Cycle Costs
- Enhanced Swales: Life Cycle Costs
- Rainwater Harvesting Cistern: Life Cycle Costs
- Vegetated Filter Strip: Life Cycle Costs
- Green Roof: Life Cycle Costs
Note: All practice cost estimates are based on a Contributing Drainage Area (CDA) of 2000 m2, runoff control target of 25 mm depth (retention or treatment), and a drainage period of 72 hours. For infiltration practices, native soil infiltration rates for Full, Partial and No Infiltration Design scenarios were assumed to be 20 mm/h, 10 mm/h and 2 mm/h, respectively, and a safety factor of 2.5 was applied to calculate the design infiltration rate. Construction cost estimates assume the practice is built as part of an overall greenfield site construction project so do not include land value, equipment mobilization/demobilization costs, nor additional costs associated with retrofit/redevelopment scenarios. Operation and maintenance (O&M) cost estimates assume annual inspections, removal of trash and debris twice a year, removal of sediment from pretreatment structures annually, and removal of weeds twice a year (where applicable). Verification inspections are included every 5 years to confirm adequate maintenance, and every 15 years to confirm adequate drainage performance through in-situ surface infiltration rate testing (where applicable).
Comparison of Life Cycle Costs by BMP Type[edit]
The following bar charts compare construction and life cycle cost estimates by LID BMP type for three main design scenarios: Full Infiltration Design; Partial Infiltration Design; and No Infiltration Design. Design and O&M assumptions for each BMP type and scenario are as indicated in the above note. All cost estimates generated by the LCCT have been divided by 2000 m2 to produce values in Canadian dollars per square metre (CAD$/m2) of Contributing Drainage Area. Cost estimates for a 2000 m2 asphalt parking lot serviced by two catch basins and an oil and grit separator (OGS) are also provided for comparison.
Construction Cost Comparisons:[edit]


Note: Click on each image to enlarge to view associated construction cost comparison results.
Life Cycle Cost Comparisons:[edit]


Note: Click on each image to enlarge to view associated life cycle cost comparison results.
References[edit]
- ↑ TRCA. 2019. Low Impact Development Life Cycle Costing Tool. Accessed 22 November 2022. https://sustainabletechnologies.ca/lid-lcct/